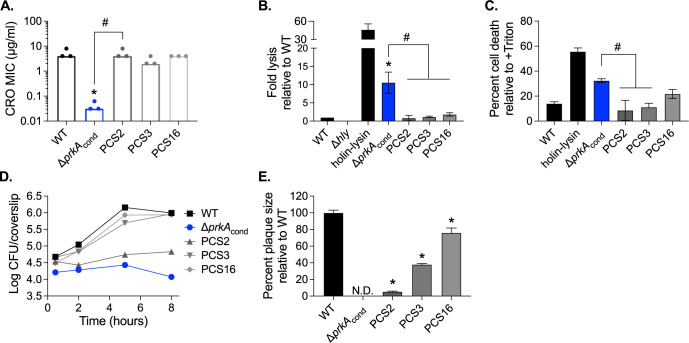
Fig 2. Suppressors of CRO sensitivity also suppress ex vivo virulence defects of a ΔprkA mutant.
(A) Bars indicate median MICs of CRO for the indicated strains; n = 3. *, P < 0.05 compared to wild type, and #, P < 0.05 for the indicated comparisons, by one-way ANOVA with Tukey’s multiple comparisons test. (B) Intracellular bacteriolysis in immortalized Ifnar-/- macrophages. Macrophages were infected with the indicated strains carrying the pBHE573 reporter vector at an MOI of 10, and luciferase activity was measured 6 hours post-infection. Error bars indicate standard error of the mean (SEM); n = 5. (C) Host cell death in primary C57BL/6 bone marrow-derived macrophages (BMDMs). BMDMs were infected with the indicated strains at an MOI of 10, and lactate dehydrogenase activity in cell supernatants was measured 6 hours post-infection. Error bars indicate SEM; n = 3. (B-C) *, P < 0.05 compared to wild type, and #, P < 0.05 compared to ΔprkAcond by one-way ANOVA with Tukey’s multiple comparisons test. (D) Intracellular growth in C57BL/6 BMDMs. BMDMs seeded on glass coverslips were infected with the indicated strains at an MOI of 10, and CFU per coverslip was enumerated at the indicated time points. Data are representative of three biological replicates. (E) Plaque formation in immortalized murine fibroblasts (L2 cells). L2s were infected with the indicated strains at an MOI of ~0.5, and plaque sizes were normalized to those of wild type on day 6 of infection. Error bars indicate SEM; data are averaged from a minimum of 15 plaques from three biological replicates. N.D., not detected. *, P < 0.05 compared to wild type by one-way ANOVA with Tukey’s multiple comparisons test.

