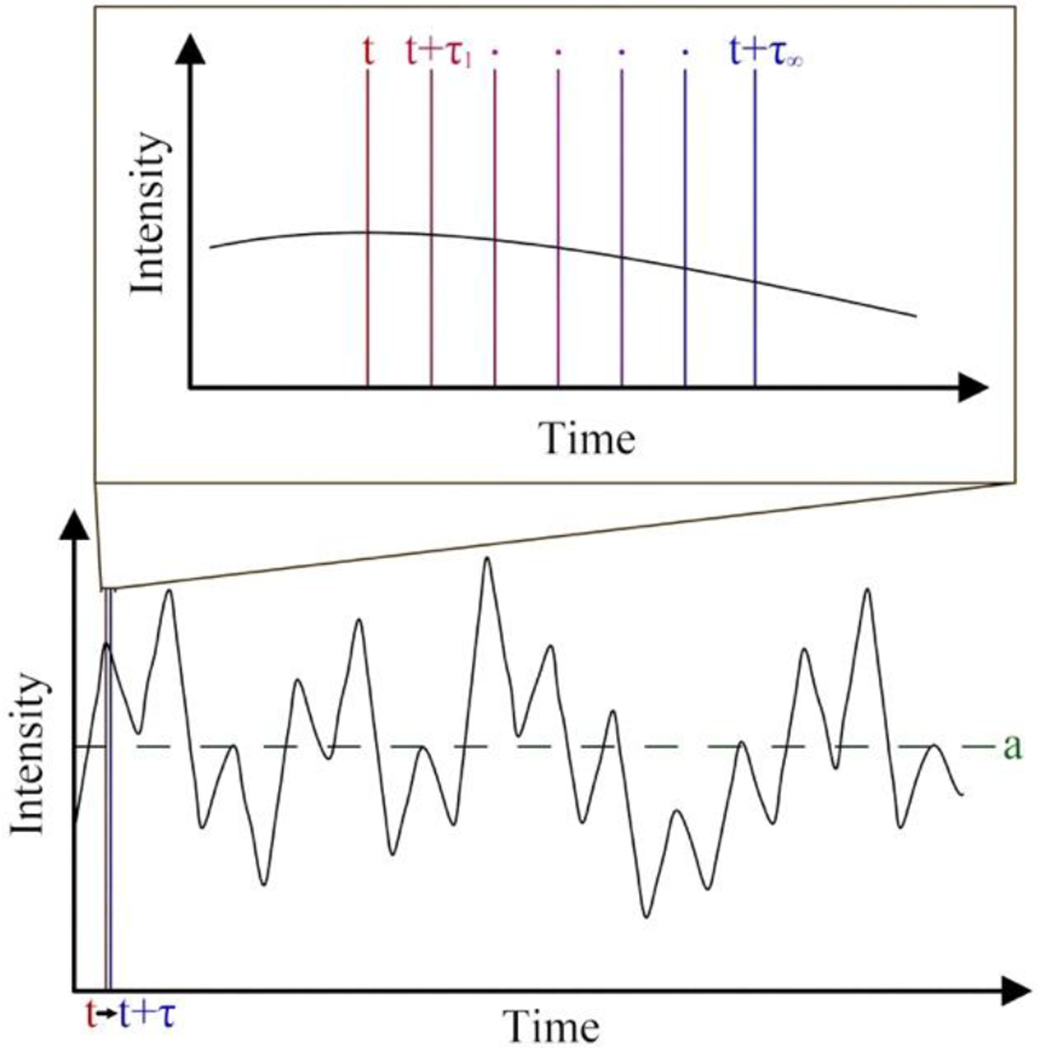
Figure 1:

The lower portion of this figure shows the Intensity of scattered light as a function of time. SLS measures the average scattering intensity represented by ‘a’ (green). The upper portion of this figure shows a magnified region of the scattered light data. DLS determines the correlation between the intensity of light scattered at time ‘t’ (red) and some later time ‘t +τ’ (blue) as a function of ‘τ’.
