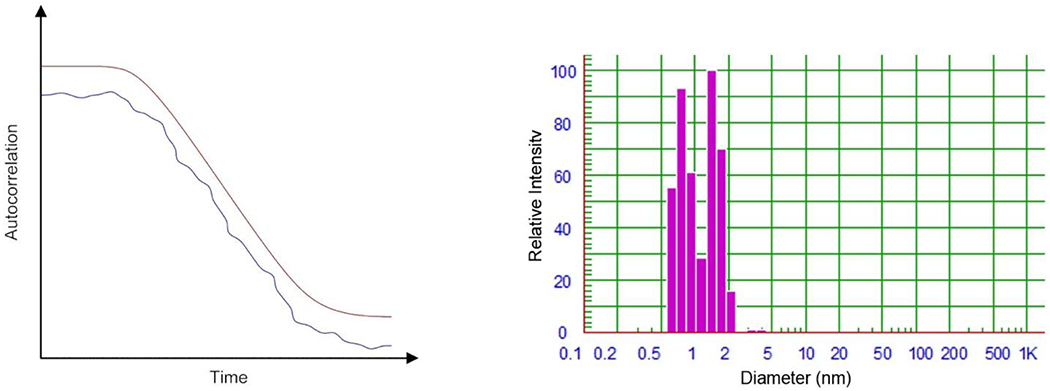
Figure 2:

a) representative examples of a well-fit autocorrelation curve (red) and a poorly-fit autocorrelation curve (blue); b) observed size data (volume weighted) upon NNLS processing of the “raw” autocorrelation function. In this case the data shows two primarily species of 0.8 and 1.5 nm diameters.
