FIGURE 2.

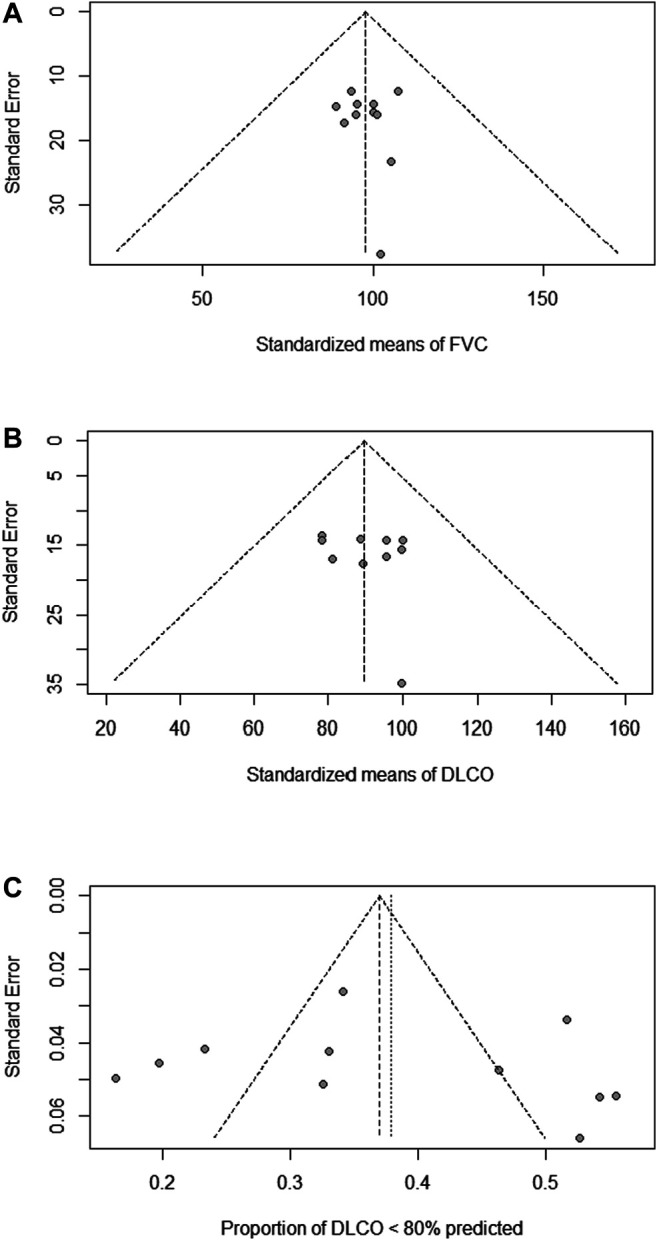
No publication bias of the meta-analysis. Funnel plots of FVC (% of predicted) (A), DLCO (% of predicted) (B) and DLCO <80% of predicted (C) were shown. Each dot represents a study.

No publication bias of the meta-analysis. Funnel plots of FVC (% of predicted) (A), DLCO (% of predicted) (B) and DLCO <80% of predicted (C) were shown. Each dot represents a study.