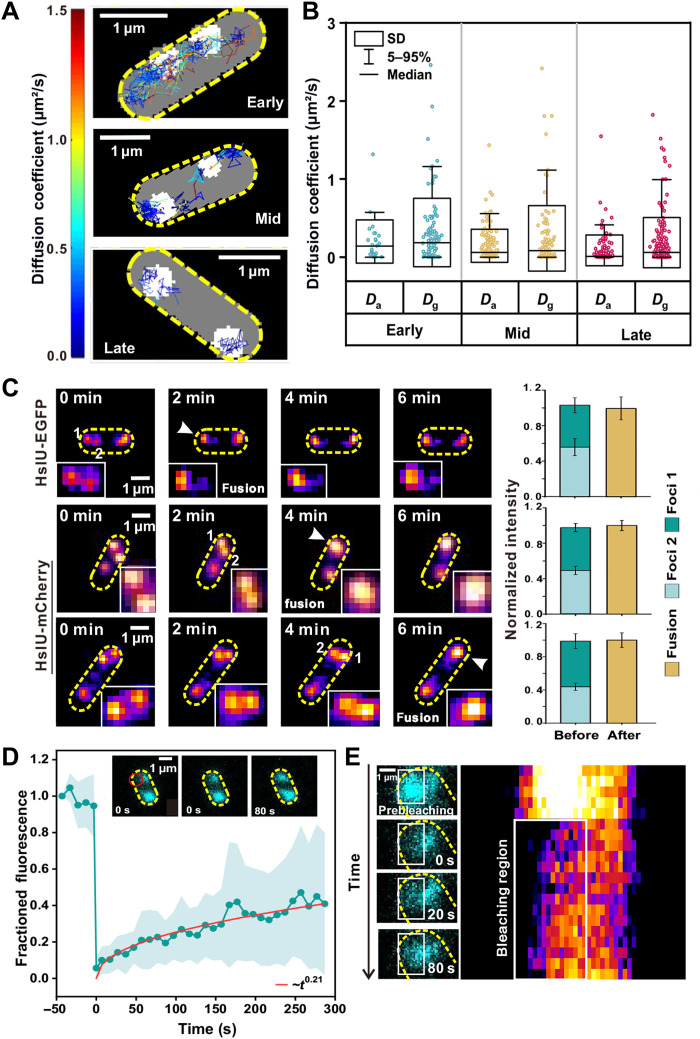
Fig. 2. Aggresome formation occurs through LLPS.
(A) Representative tracking of HslU-EGFP foci during aggresome formation, color corresponding to diffusion coefficient (left bar). (B) Box plots of Dg and Da of HslU-EGFP at different time points. Dg, diffusion coefficient of single molecules inside aggresomes; Da, diffusion coefficient of the aggresomes. (C) Left: Representative epifluorescence images of two aggresomes fusing. Right: Total fluorescence intensity of aggresomes before and after fusion. Error bar represents the SD pixel noise. (D) Mean fluorescence recovery curve (cyan) defined from half region of an aggresome indicating a mean recovery half-time of 50 ± 9 s and a heuristic power law fit (red: ~t0.21), with inset half-FRAP images of an aggresome showing fluorescence recovery, position of focused FRAP laser waist indicated (red). Error bounds show SD (number of aggresomes N = 29, each from a different cell). (E) Zoom-in of aggresome showing fluorescence recovery with kymograph (right heatmap).

