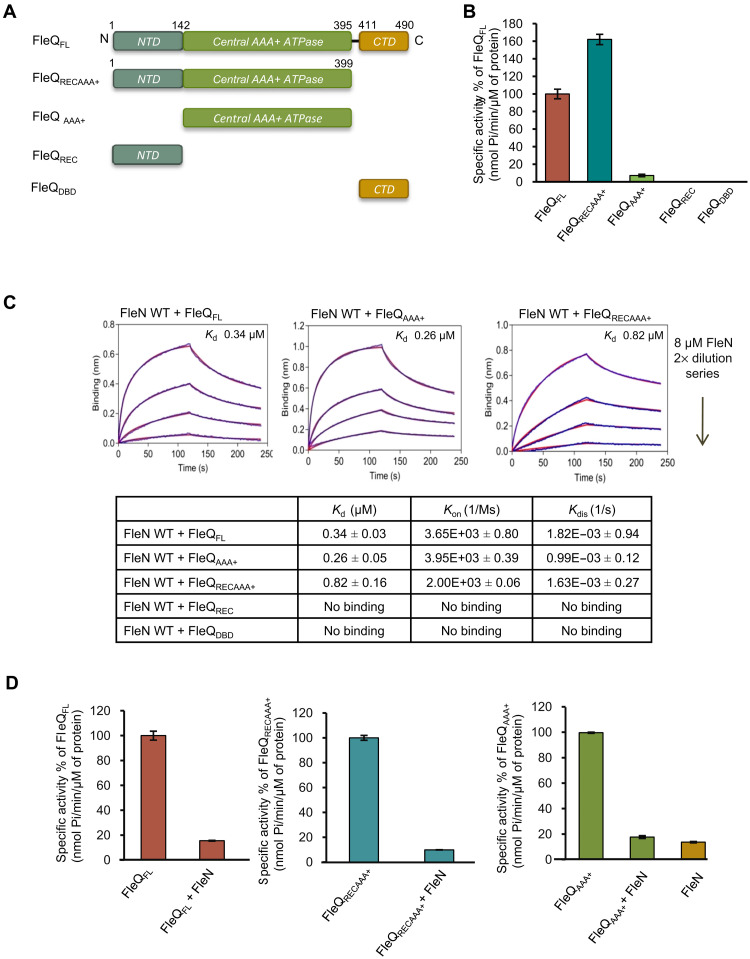
Fig. 1. Interaction of different domains of FleQ with FleN.
(A) Schematic representation of series of constructs of FleQ used in the manuscript. The domains FleQREC, FleQAAA+, and FleQDBD are shown in gray, green, and pale orange colors, respectively. (B) The ATPase activity of FleQFL and various domain constructs (1 μM) was measured in the presence of 2 mM ATP. The specific activities of ATP hydrolysis (nmol Pi/min per μM protein) are plotted in percentage of FleQFL on the y axis for each construct. (C) BLI curves showing interaction of FleN with either FleQFL or FleQAAA+ or FleQRECAAA+. The x and y axes represent time (in seconds) and nanometer shift on binding, respectively. The first part of the curve (0 to 120 s) represents association, and the second part of the curve (from 120 to 240 s) represents dissociation. The curves in blue and red colors indicate experimental and fitting data, respectively. The dissociation constant (KD, μM) of interaction between FleN and different constructs of FleQ is shown in the table. Rate of association and dissociation is shown as Kon (1/Ms) and Kdis (1/s), respectively. No binding was recorded in case of FleQREC and FleQDBD constructs, as no significant shift in nanometers on the y axis was observed. (D) Inhibition of the ATPase activity of FleQFL, FleQRECAAA+, and FleQAAA+ in the presence of FleN WT is shown as a specific activity (nmol Pi/min per μM protein) on the y axis. For the experiments, 1 μM FleQ or its constructs, 5 μM FleN WT, and 2 mM ATP were used.

