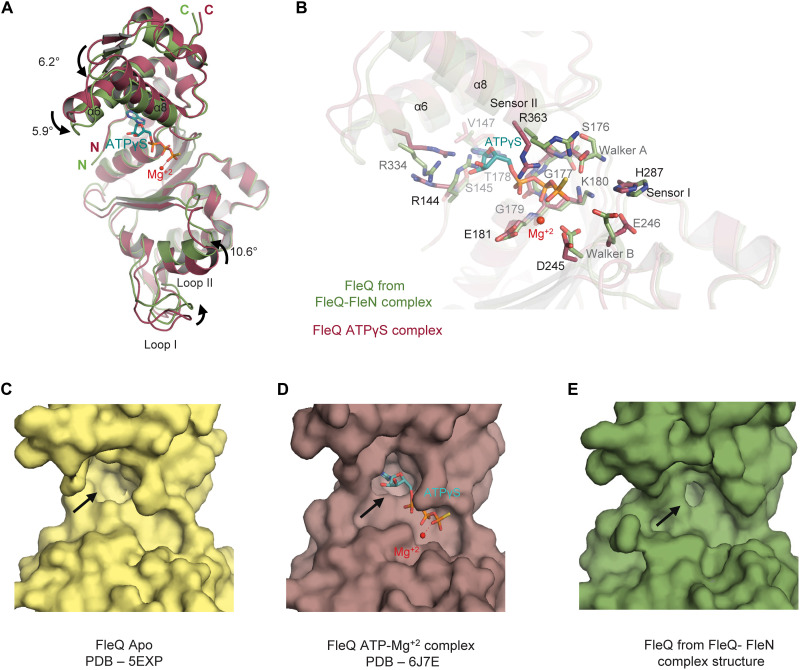
Fig. 3. Conformational changes in FleQ AAA+ domain.
(A) Superimposition of FleQ from ATPγS-Mg+2–bound structure (raspberry, PDB: 6J7E) onto FleQ (green) from the FleN-ATPγS-FleQAAA+ complex structure highlights the conformational changes on FleN binding. ATPγS and Mg+2 are shown in cyan stick and red sphere, respectively. The curved arrows show the movement of different helices and loop1. (B) Conformational changes of different residues in the ATP binding pocket of FleQAAA+ upon interaction with FleN are depicted. Color coding is the same as in (A). (C) Surface representation of FleQAAA+ in Apo structure (pale yellow, PDB: 5EXP). (D) Surface representation of FleQAAA+ in the ATPγS- and Mg+2-bound structure (raspberry, PDB: 6J7E). (E) Surface representation of FleQAAA+ in the FleN-ATPγS-FleQAAA+ structure (green) depicting the conformation of ATP binding pocket (shown with black arrows).

