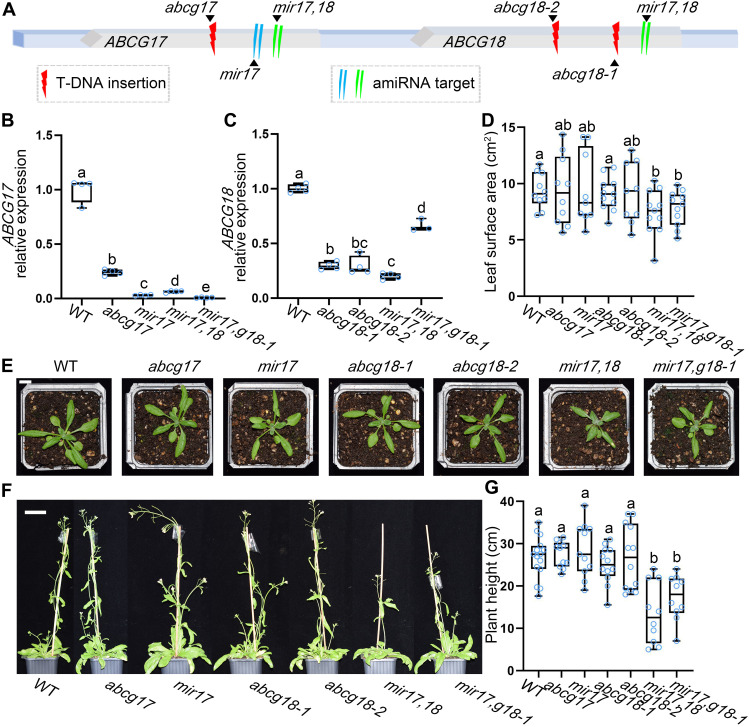
Fig. 2. ABCG17 and ABCG18 redundantly regulate plant growth.
(A) Illustration of the ABCG17 and ABCG18 genome region. T-DNA insertions and amiRNA knockdown sites are indicated. (B and C) Relative expression levels of ABCG17 (B) and ABCG18 (C) in the indicated genotypes. mir17,18 is the abcg17 and abcg18 double-knockdown amiRNA line; mir17,g18-1 is mir17 (amiRNA-ABCG17) transformed into the background of abcg18-1 T-DNA insertion line. Shown are averages (±SD), n = 4; different letters represent significant differences, one-way ANOVA with Student’s t test (P < 0.05). (D) Leaf surface area of the indicated lines. Shown are averages (±SD), n ≥ 9 plants; different letters represent significant differences, one-way ANOVA with Student’s t test (P < 0.05). (E) Shoot phenotypes of 25-day-old plants grown in soil under normal conditions. Scale bar, 1 cm. (F) Phenotypes of 50-day-old plants grown in soil under normal conditions. Scale bar, 2 cm. (G) Quantification of inflorescence stem height of the indicated genotypes. Shown are averages (±SD), n ≥ 10 plants; different letters represent significant differences, one-way ANOVA with Student’s t test (P < 0.05). Photo credit: Yuqin Zhang, Tel Aviv University.

