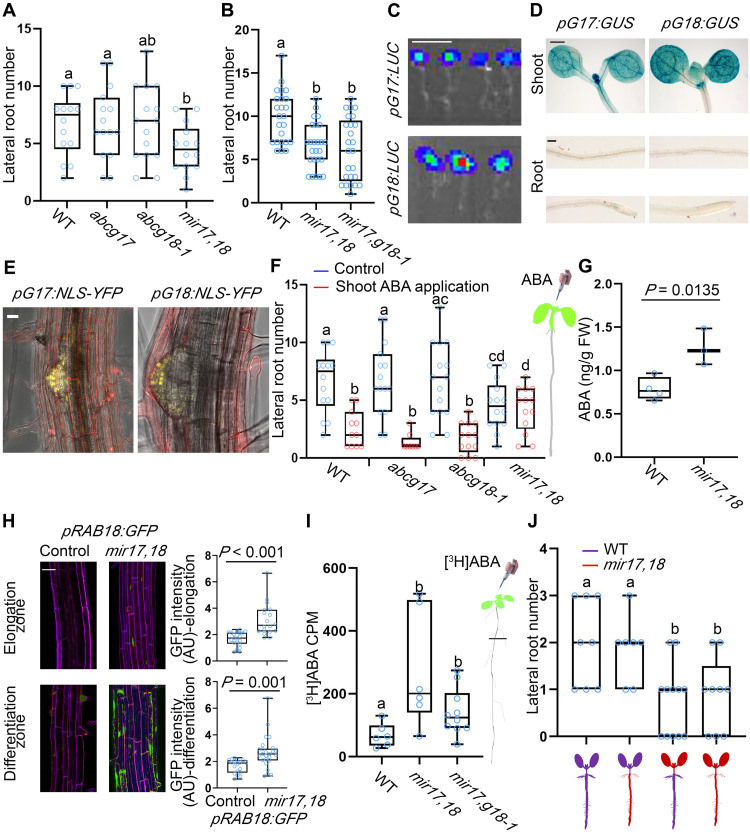
Fig. 6. ABCG17 and ABCG18 are required for long-distance ABA transport and regulation of lateral root formation.
(A or B) Lateral root numbers of 10-day-old seedlings, n ≥ 14 (A) and n ≥ 18 (B). (C) Bioluminescence signal driven by pABCG17:LUC (pG17:LUC) or pABCG18:LUC (pG18:LUC). Scale bar, 1 cm. (D) GUS staining for pABCG17:GUS (pG17:GUS) and pABCG18:GUS (pG18:GUS) in shoot and root of 5-day-old seedlings. Scale bars, 0.5 mm for shoots and 0.1 mm for roots. (E) Representative images of pABCG17:NLS-YFP (pG17:NLS-YFP) and pABCG18:NLS-YFP (pG18:NLS-YFP) lateral root emergence sites. Scale bar, 20 μm. (F) Lateral root numbers for the indicated genotypes. Shoots of 4-day-old plants were treated with 5 μM ABA for 4 days, n ≥ 13. Right is shoot-specific ABA application illustration. (G) ABA quantification in roots of indicated genotypes (12-day-old plants). FW, fresh weight. n ≥ 3; P value indicates significant differences, Student’s t test. (H) pRAB18:GFP signal in the background of mir17,18 and control roots (left) and the quantification of respective GFP signal intensity (right). Green represents GFP fluorescent signal, and purple represents propidium iodide. Scale bar, 20 μm. n ≥ 7; P value indicates significant differences, Student’s t test. (I) [3H]ABA counts per minute (CPM) in roots only of the indicated phenotypes (roots were isolated as indicated by a black line in the illustration on the right). Background measurements from control samples (no [3H]ABA treatment) were deduced, n ≥ 6. (J) Lateral root number quantification of the indicated grafted lines, n ≥ 7. For all graphs, shown are averages (±SD); different letters represent significant differences, one-way ANOVA with Student’s t test (P < 0.05).

