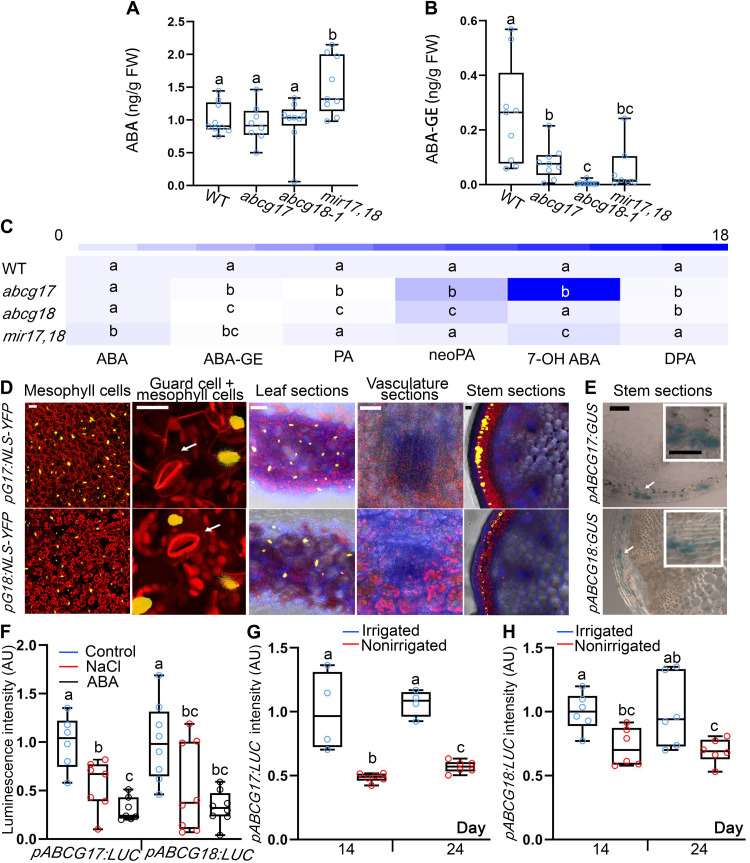
Fig. 7. ABCG17 and ABCG18 are primarily expressed in mesophyll and cortex cells, allowing ABA-GE formation under normal conditions.
(A and B) Quantification of ABA (A) and ABA-GE (B) in shoots of 12-day-old plants of the indicated genotypes. Shown are averages (±SD), n ≥ 7; different letters represent significant differences, one-way ANOVA with Student’s t test (P < 0.05). (C) ABA metabolites profile heatmap in shoots of 12-day-old plants of the indicated genotypes. Absolute values and abbreviations are presented in fig. S16. Shown are averages (±SD), n ≥ 7, different letters represent significant differences, one-way ANOVA with Student’s t test (P < 0.05). (D) pABCG17:NLS-YFP (pG17:NLS-YFP) and pABCG18:NLS-YFP (pG18:NLS-YFP) signal (yellow) in leaves and stem. YFP signal is detected in mesophyll and cortex cells. Chlorophyll is in red. Fluorescent brightener is in blue. White arrows point to the guard cells. Scale bars, 20 μm. (E) GUS staining for pABCG17:GUS (pG17:GUS) and pABCG18:GUS (pG18:GUS) in inflorescence stem of 30-day-old plants. Scale bar, 100 μm. Insets are magnifications of areas indicated by white boxes. Scale bars, 50 μm. (F) Luminescence intensity of pABCG17:LUC (pG17:LUC) and pABCG18:LUC (pG18:LUC) with and without 5 μM ABA or 100 mM NaCl treatment. Shown are averages (±SD), n ≥ 6; different letters represent significant differences, one-way ANOVA with Student’s t test (P < 0.05). (G and H) Luminescence intensity of pABCG17:LUC (pG17:LUC) (G) and pABCG18:LUC (pG18:LUC) (H). Plants were irrigated for 15 days followed by water withhold for 3 weeks. Control plants (irrigated) were watered throughout the experiment. Shown are averages (±SD), n ≥ 4; different letters represent significant differences, one-way ANOVA with Student’s t test (P < 0.05).

