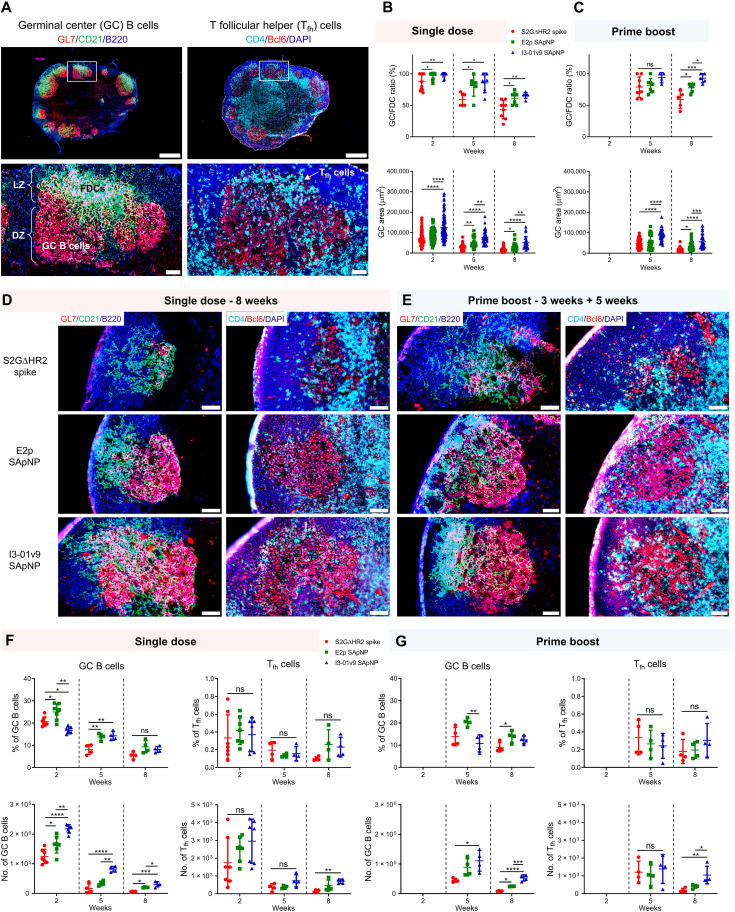
Fig. 6. SARS-CoV-2 SApNP vaccines induce robust long-lived GCs.
(A) Top: Representative immunohistological images of GCs at week 2 after a single-dose injection of the S2GΔHR2-presenting I3-01v9 SApNP vaccine (10 μg per injection, 40 μg per mouse). Bottom: GC B cells (GL7+, red) adjacent to FDCs (CD21+, green) in lymph node follicles (left) and Tfh cells in the light zone (LZ) of GCs (right). Scale bars of 500 and 50 μm are shown for a complete lymph node and an enlarged image of a follicle, respectively. DZ, dark zone. (B and C) Quantification of GC reactions using immunofluorescent images: GC/FDC ratio and sizes of GCs 2, 5, and 8 weeks after (B) single-dose or (C) prime-boost injections (n = 4 to 7 mice per group). The GC/FDC ratio is defined as whether the GC formation is associated with an FDC network (%). (D and E) Representative immunohistological images of GCs in mice immunized using S2GΔHR2 spike or S2GΔHR2-presenting E2p and I3-01v9 SApNP vaccines at week 8 after (D) single-dose or (E) prime-boost injections, with a scale bar of 50 μm shown for each image. DAPI, 4′,6-diamidino-2-phenylindole. (F and G) Quantification of GC reactions using flow cytometry: percentage and number of GC B cells and Tfh cells 2, 5, and 8 weeks after (F) single-dose or (G) prime-boost injections. The data points are shown as means ± SD. The data were analyzed using one-way ANOVA followed by Tukey’s multiple comparison post hoc test for each time point. *P < 0.05, **P < 0.01, ***P < 0.001, and ****P < 0.0001.

