
Figure 5.
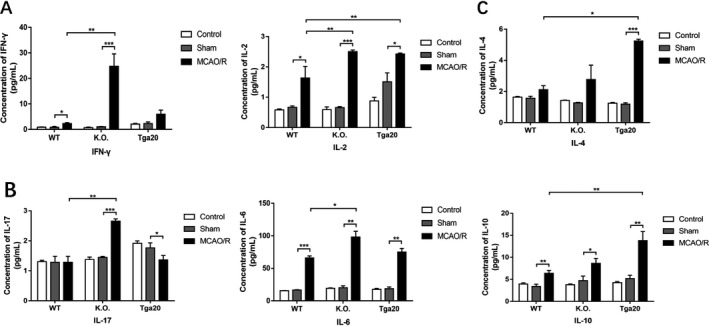
Flow cytometry‐based evaluation of concentrations of Th1/17‐related pro‐inflammatory and Th2‐related anti‐inflammatory cytokines in serum (WT n = 6, KO n = 6, Tga20 n = 6). (A) The expression of Th1‐related pro‐inflammatory cytokines. (B) The expression of Th17‐related pro‐inflammatory cytokines. (C) The expression of Th2‐related anti‐inflammatory cytokines. Experiments were carried out in biologically triplicate and data are displayed as mean ± standard deviation (SD), *P < 0.05, **P < 0.01, ***P < 0.001.