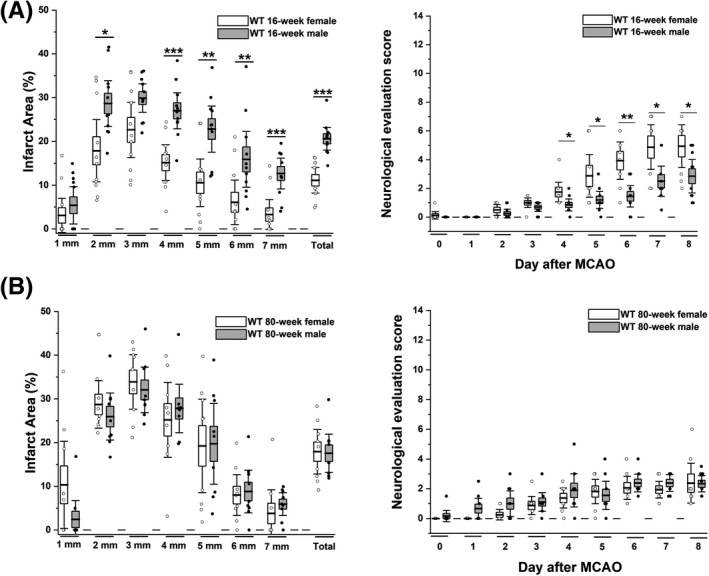
Figure 1.

Comparison of stroke severity in young and old female versus male mice. Percent of infarcted hemisphere area was determined by T2‐weighted MRI on day 8 after daily neurological deficit scoring. (A) Infarct area and deficit score in 16‐week‐old female (n = 11) were compared to male (n = 10) mice (p < 0.001 for infarct, p = 0.029 for NES). (B) Infarct area and deficit score in 80‐week‐old female (n = 9) were compared to male (n = 9) mice (p = 0.623 for infarct, p = 0.446 for NES). Data are shown as whisker plots with data overlay. The boxes show mean ± SEM and the whiskers show confidence intervals.
