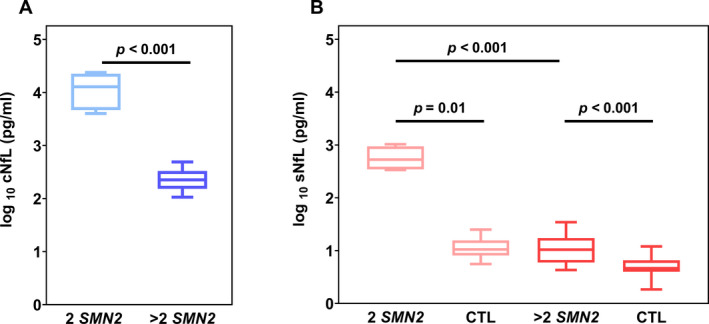
Figure 2.

Neurofilament concentrations in patients with SMA and age‐matched controls. NfL values of patients with 2 SMN2 copies and patients with >2 SMN2 copies (A) in CSF (cNfL, shades of blue) (B) and serum (sNFL, shades of red) compared to their age‐matched neurologically healthy controls (CTL). Boxplots show minimum, maximum, and median levels as well as the interquartile range (25% and 75% percentile). Significant differences between groups are displayed by P values (Mann–Whitney‐U test).
