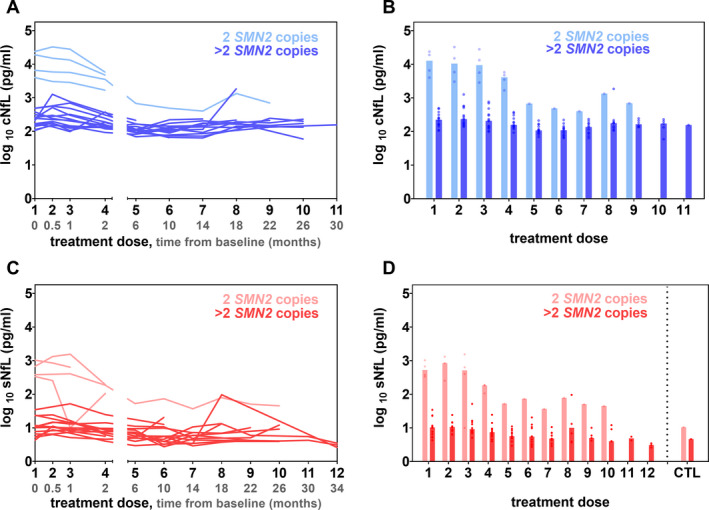
Figure 3.

(A, C) cNfL (shades of blue) and sNfL (shades of red) concentrations in pg/mL over time before and during treatment with nusinersen for individual participants (n = 18). The two subgroups of SMA patients with 2 SMN2 and >2 SMN2 copies are displayed in different color intensities. The x‐axis shows treatment doses (black) and time from the initiation of nusinersen treatment (baseline, grey) in months. (B) Median cNfL levels and (D) median sNfL values represented by bars with dots showing individual values in comparison to the median sNfL values of healthy age‐matched controls (CTL).
