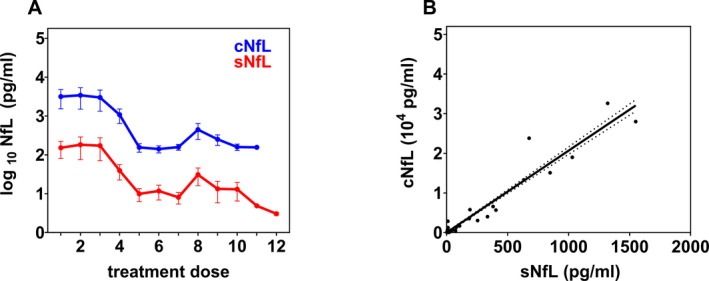
Figure 4.

(A) Neurofilament concentrations in CSF (cNfL) and serum (sNfL) of all SMA patients during the course of nusinersen treatment (corresponding time points see Fig. 3A). Data points and error bars correspond to means and SEM, respectively. (B) Correlation between all cNfL and sNfL values of all SMA patients. The linear regression line and 95% confidence interval (dotted curves) are depicted
