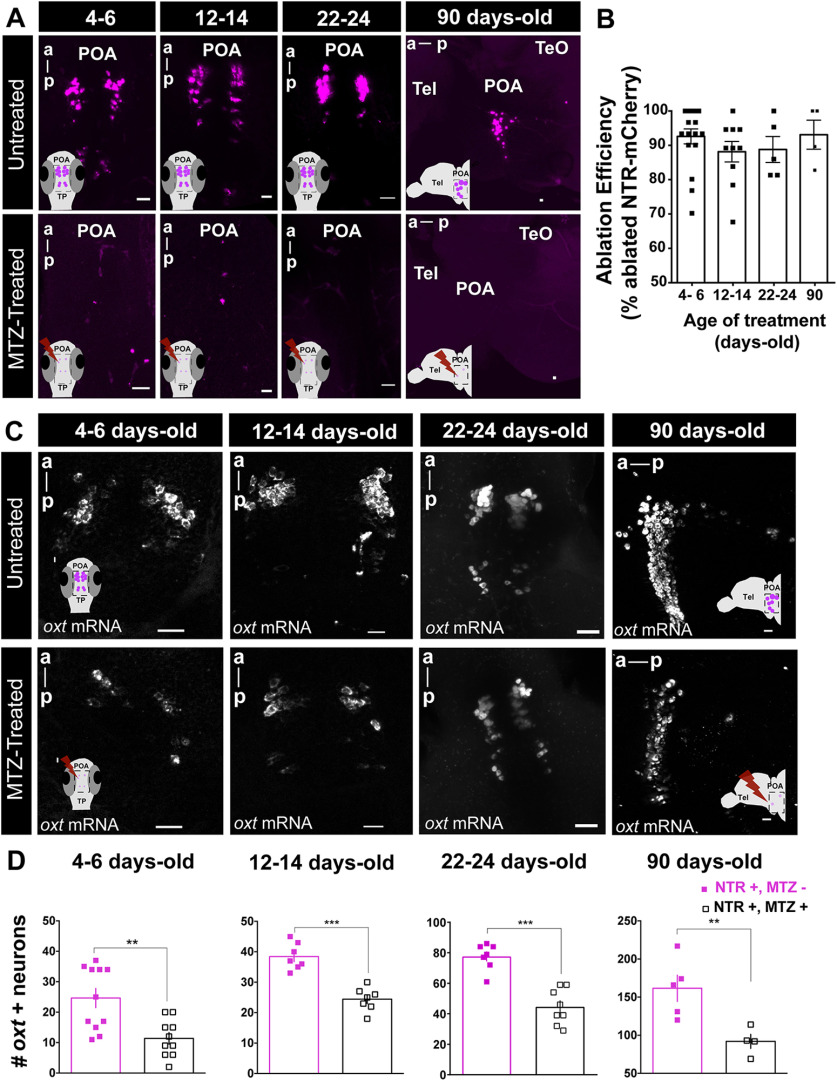
Figure 2.
Spatiotemporal control of OXT-specific transgene expression. A, Representative example of the MTZ treatment effect on transgene (oxt:GAL4;UAS-NTR-mCherry) at different treatment time points. For 4–6, 12–14, and 22–24 d old, whole-mount larvae, maximum intensity confocal z-stack image, dorsal view, anterior to top; for 90 d old: sagittal brain slice, maximum intensity confocal z-stack image, anterior to left. B, Quantification of the effect of MTZ treatment on transgene expression at all ages tested (4–6 d old, n = 17; 12–14 d old, n = 10; 22–24 d old, n = 5; 90 d old, n = 4). Ablation efficiency was measured as percentage of ablated cells in MTZ-treated fish over mean number of NTR-mCherry cells in untreated fish. C, Representative examples of the effects of MTZ-induced ablation on endogenous OXT as detected by in situ hybridization of oxt mRNA, at different treatment time points. Four- to 6-, 12- to 14-, and 22- to 24-d-old treatment: whole-mount larvae confocal maximum intensity z-stack image, dorsal view, anterior to top; 90-d-old treatment: sagittal brain slice, confocal maximum intensity z-stack image, anterior to left. D, Quantification of the number of cells expressing OXT mRNA in untreated fish or following MTZ treatment at 4- to 6-, 12- to 14-, 22- to 24-, and 90-d-old treatment. Scale bar: 20 μm. Data presented as mean ± SEM. Full squares: untreated fish (NTR+, MTZ-); open squares: MTZ-treated fish (NTR+, MTZ+); **p < 0.01, ***p < 0.001. a, anterior; p, posterior; POA, preoptic area; TeO, optical tectum; Tel, telencephalon.

