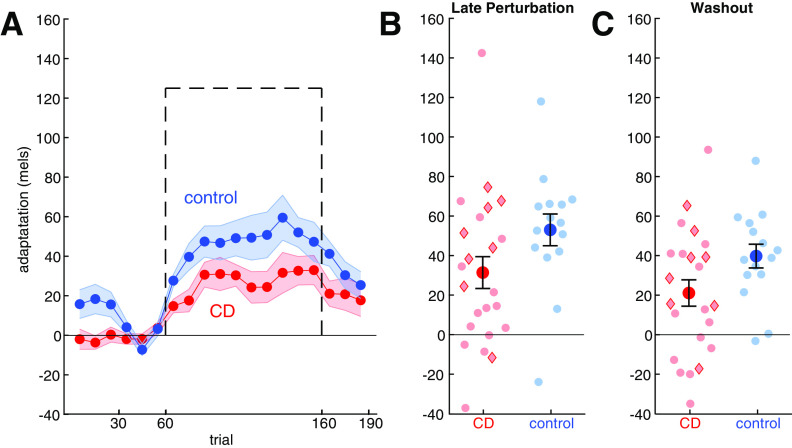
Figure 4.
In the speech adaptation task, the cerebellar degeneration (CD) group adapted less than controls. A, Change in first formant over the course of the experimental condition. Means and SEs are shown for control (blue) and CD participants (red). For each participant, the change was calculated relative to the mean F1 value during the second half of the baseline phase, with positive values corresponding to changes in the opposite direction of perturbation. The perturbation is shown with a dashed black line (sign flipped). B, C, Group means ± SE (solid dots) and individual data points (semitransparent dots) of adaptive response during the last 10 trials of the perturbation phase and first 10 trials of the washout phase. Red diamonds indicate individuals with SCA6 and SCA8; red circles indicate the other CD participants.

