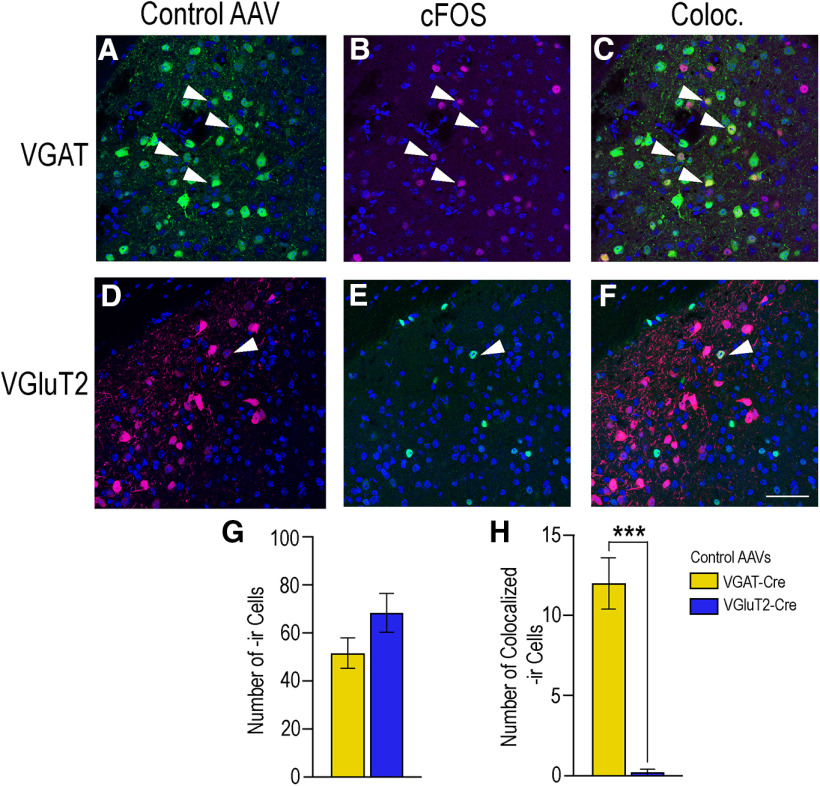
Figure 12.
Activation of VGAT and VGluT2 neurons in the MeApd during sexual receptivity. Images in the top row show VGAT (green, A), c-Fos (magenta, B), and the colocalization of the two (C) in the MeApd. Images in the bottom row show VGluT2 (magenta, D), c-Fos (green, E), and colocalization (F). In sexually receptive control mice, c-Fos expression in the MeApd was not different between control VGAT-Cre mice (51.80 ± 6.35; B) and control VGluT2-Cre mice (68.60 ± 8.07; D). In these control mice, c-Fos colocalization was significantly greater in VGAT-Cre mice (12.00 ± 1.61; G) than in VGluT2-Cre mice (0.20 ± 0.20, p = 0.002; H). DAPI counterstain in blue. Arrows indicate colocalization of immunoreactivity within cells in the MeApd. Yellow bars represent VGAT-Cre, blue bars represent VGluT2-Cre. Values expressed as mean ± SEM; ***p < 0.005. Scale bar: 25 µm.

