Figure 2.
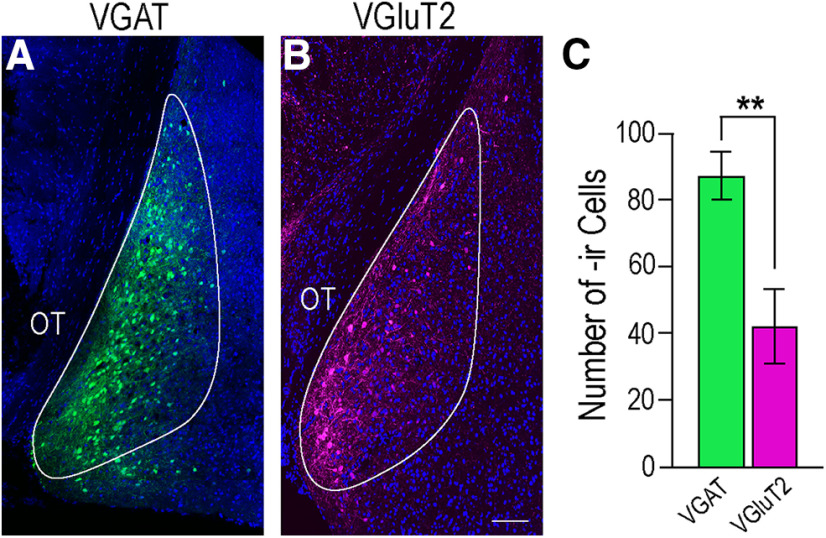
VGAT and VGluT2 expression in the MeApd. Cells expressing either VGAT (green, A) or VGluT2 (magenta, B) were found medially in the MeApd. DAPI counterstain is indicated in blue, the MeApd is outlined in white in each image. C, More neurons expressed VGAT (87.20 ± 7.17, green bar) compared with VGluT2 (42.00 ± 11.22, magenta bar; p = 0.009). Values expressed as mean SEM; **p < 0.01. OT, optic tract. Scale bar: 100 µm.

