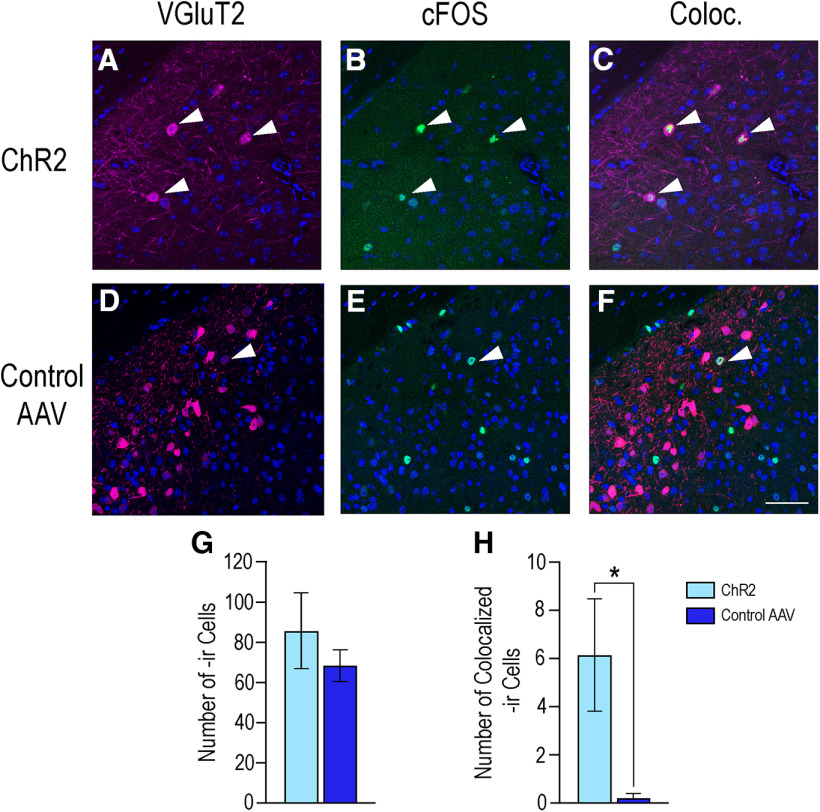
Figure 8.
Photoexcitation of ChR2-expressing VGluT2 neurons did not alter overall c-Fos-ir but did reduce colocalization with VGluT2 neurons. Photomicrographs in the top row are of the expression of VGluT2 (A), c-Fos (B), and the colocalization of the two (Coloc., C) in the MeApd in mice that received ChR2. The bottom row shows the expression of VGluT2 (D), c-Fos (E), and colocalization (Coloc., F) in the MeApd of mice that received the control virus. VGluT2-ir is depicted in magenta, c-Fos-ir in green, DAPI counterstain in blue. Arrows indicate colocalization of immunoreactivity within specific cells in the MeApd. G, Graph shows that there was no difference in total c-Fos expression between mice that received ChR2 (85.7 ± 18.9; light blue bars) and those that received the control virus (68.6 ± 8.07, p = 0.49; dark blue bars). However, photoexcitation of ChR2 (graph H) resulted in an increase of c-Fos expression within VGluT2 neurons (6.14 ± 2.32) as compared with the control mice (0.20 ± 0.20; p = 0.04). Values expressed as mean ± SEM; *p < 0.05. Scale bar: 25 µm.

