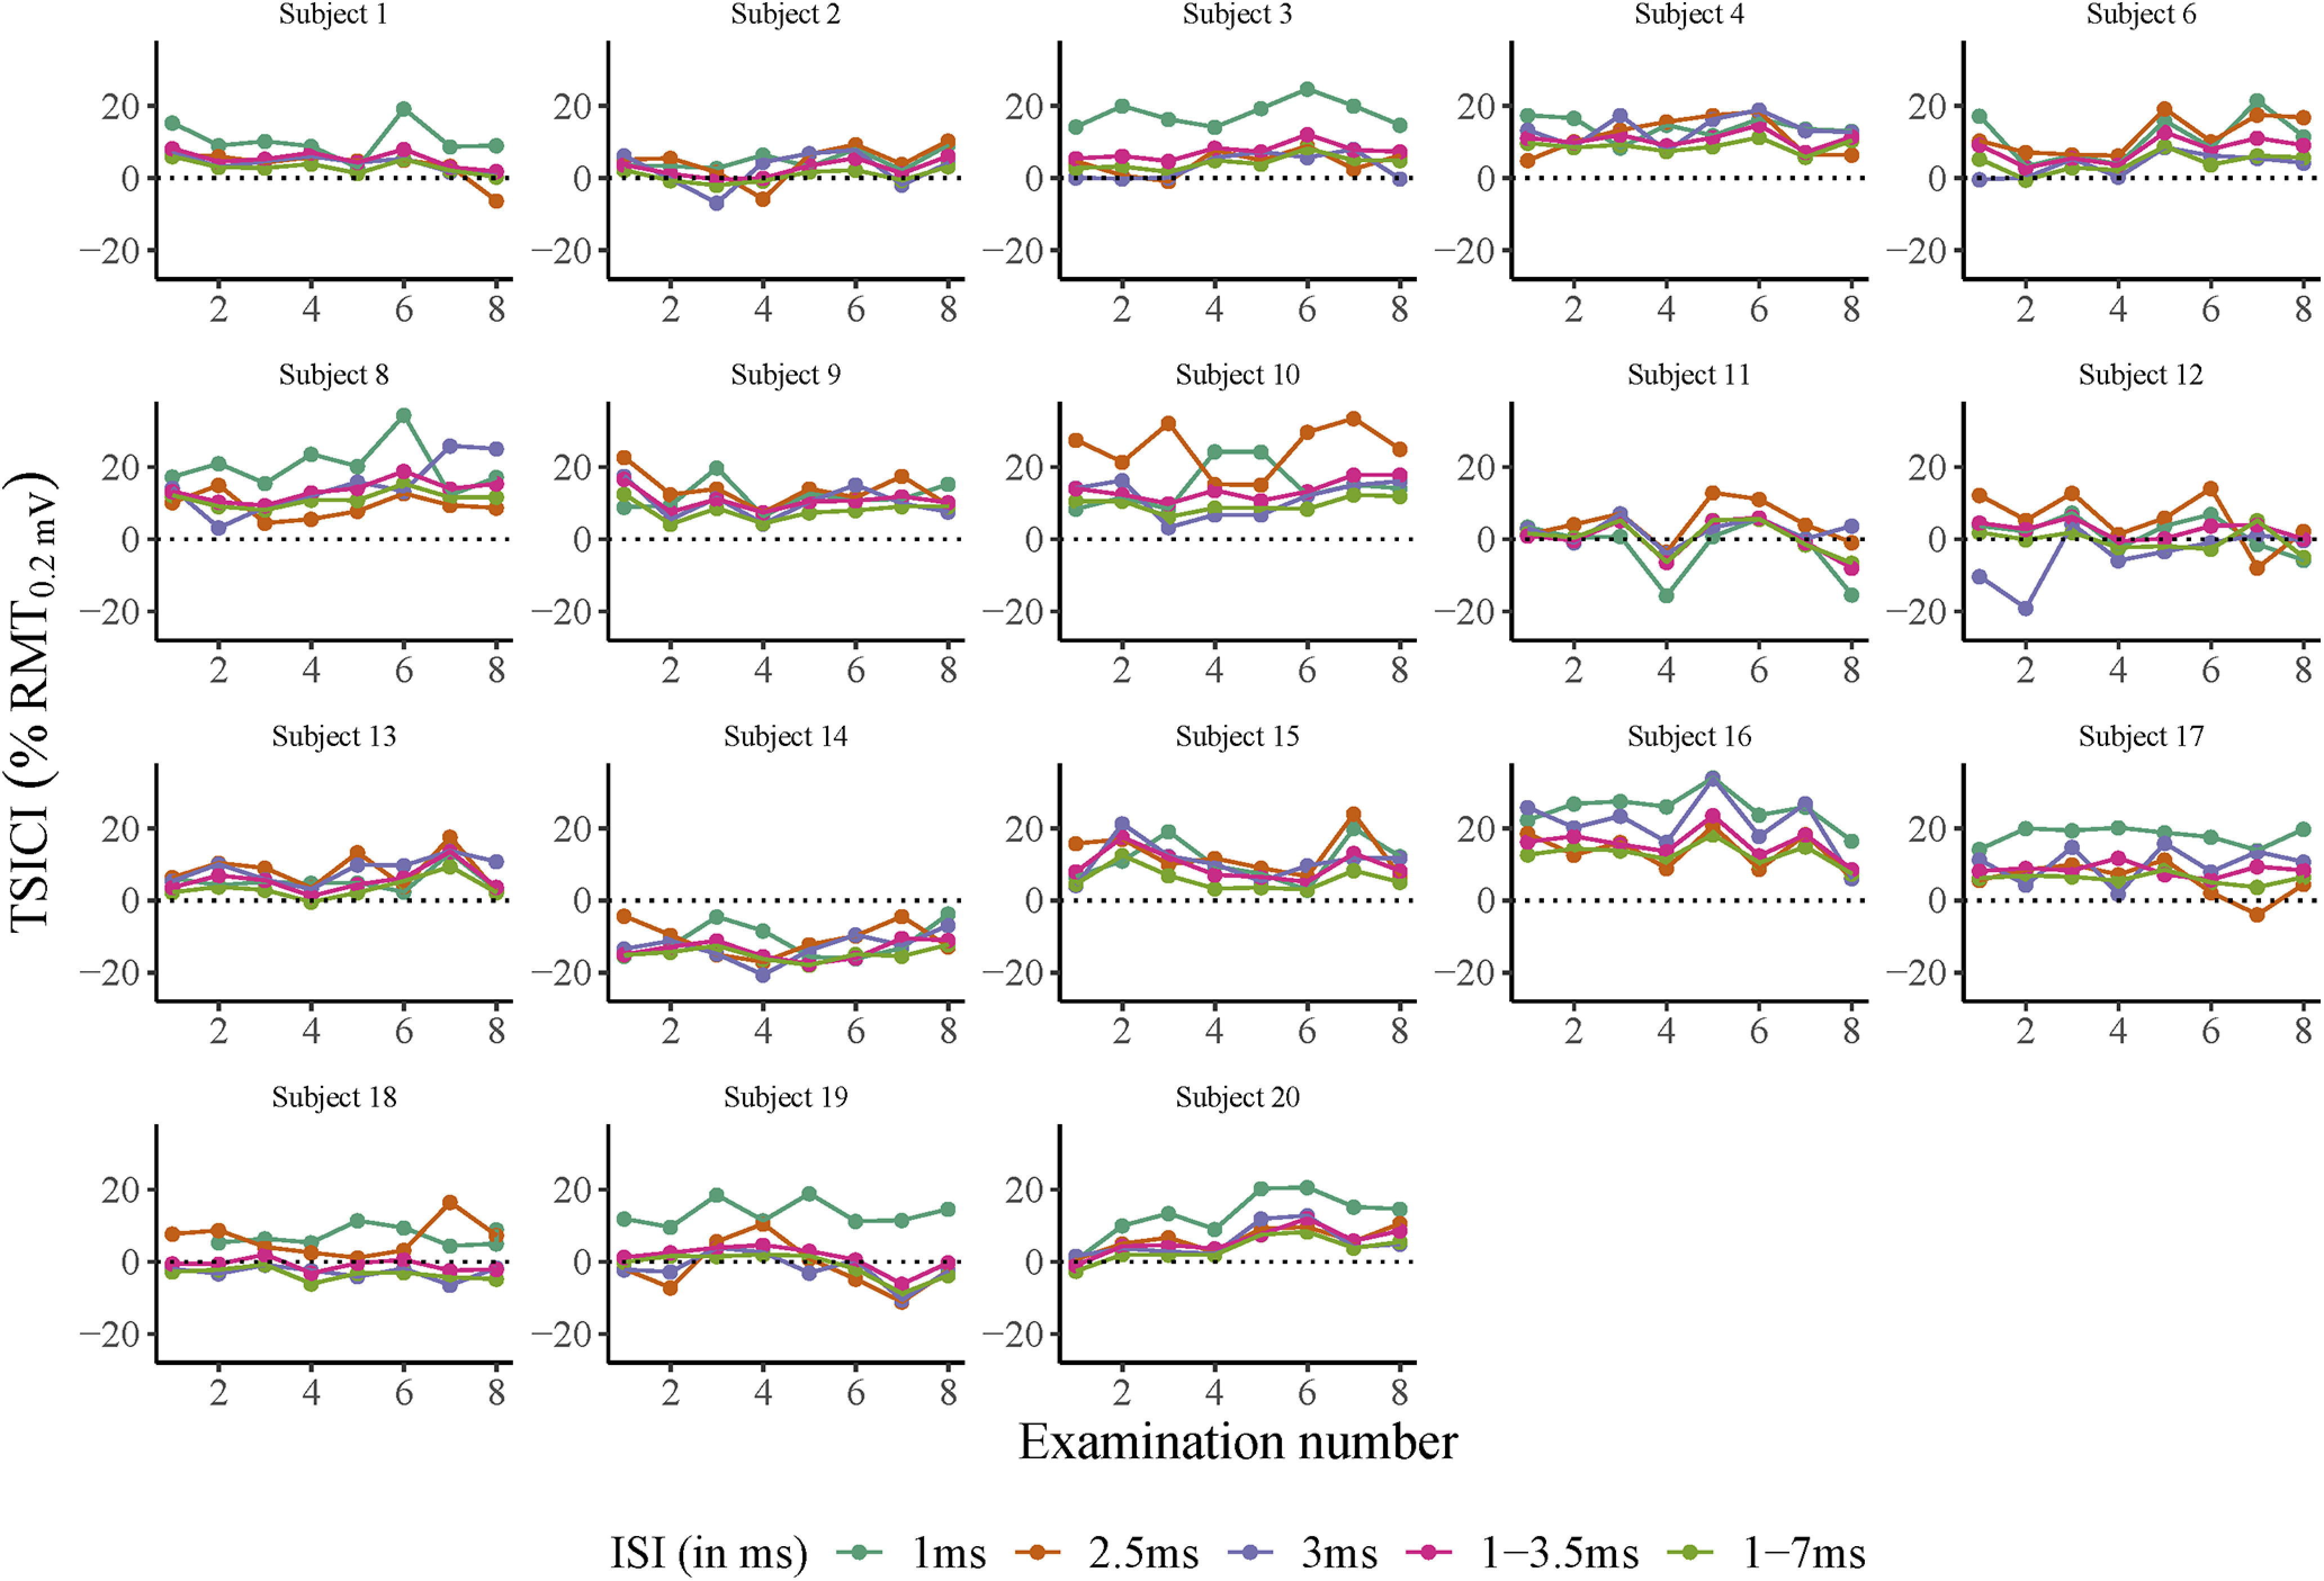
Figure 5.

Intraobserver T-SICI examinations for all subjects. x-axis: examination number. y-axis: SICI measured with TT-TMS. Horizontal dotted line denotes threshold for cortical facilitation (T-SICI < 0, in % RMT0.2mV) or inhibition (T-SICI > 0, in % RMT0.2mV). ISI of 1, 2.5, 3, 1–3.5, and 1–7 ms are depicted in different colors. Each subfigure denotes measurements from one individual subject. Subject number 5 (undetectable MEP) and subject number 7 (unrelaxed hand muscles) were excluded.
