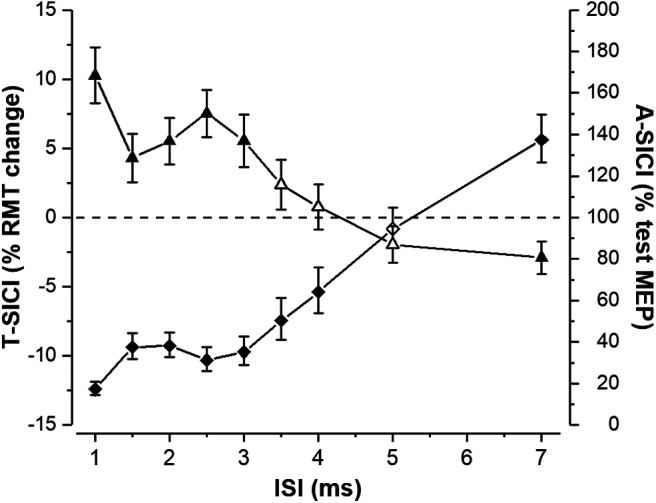
Figure 6.

Mean group TT-TMS and cTMS SICI curves. Group means of T-SICI (arithmetic, depicted by triangles) and A-SICI (geometric, depicted by diamonds) were calculated by averaging all 18 individual subjects’ means across all measurements. Error bars represent SEM (±SEM for T-SICI, ×/÷SEM for A-SICI). Filled symbols represent a significant inhibition or facilitation when compared with the control condition (0% RMT0.2mV for TT-TMS and 100% test MEP for cTMS; one-sample t test p < 0.05).
