
Figure 9.
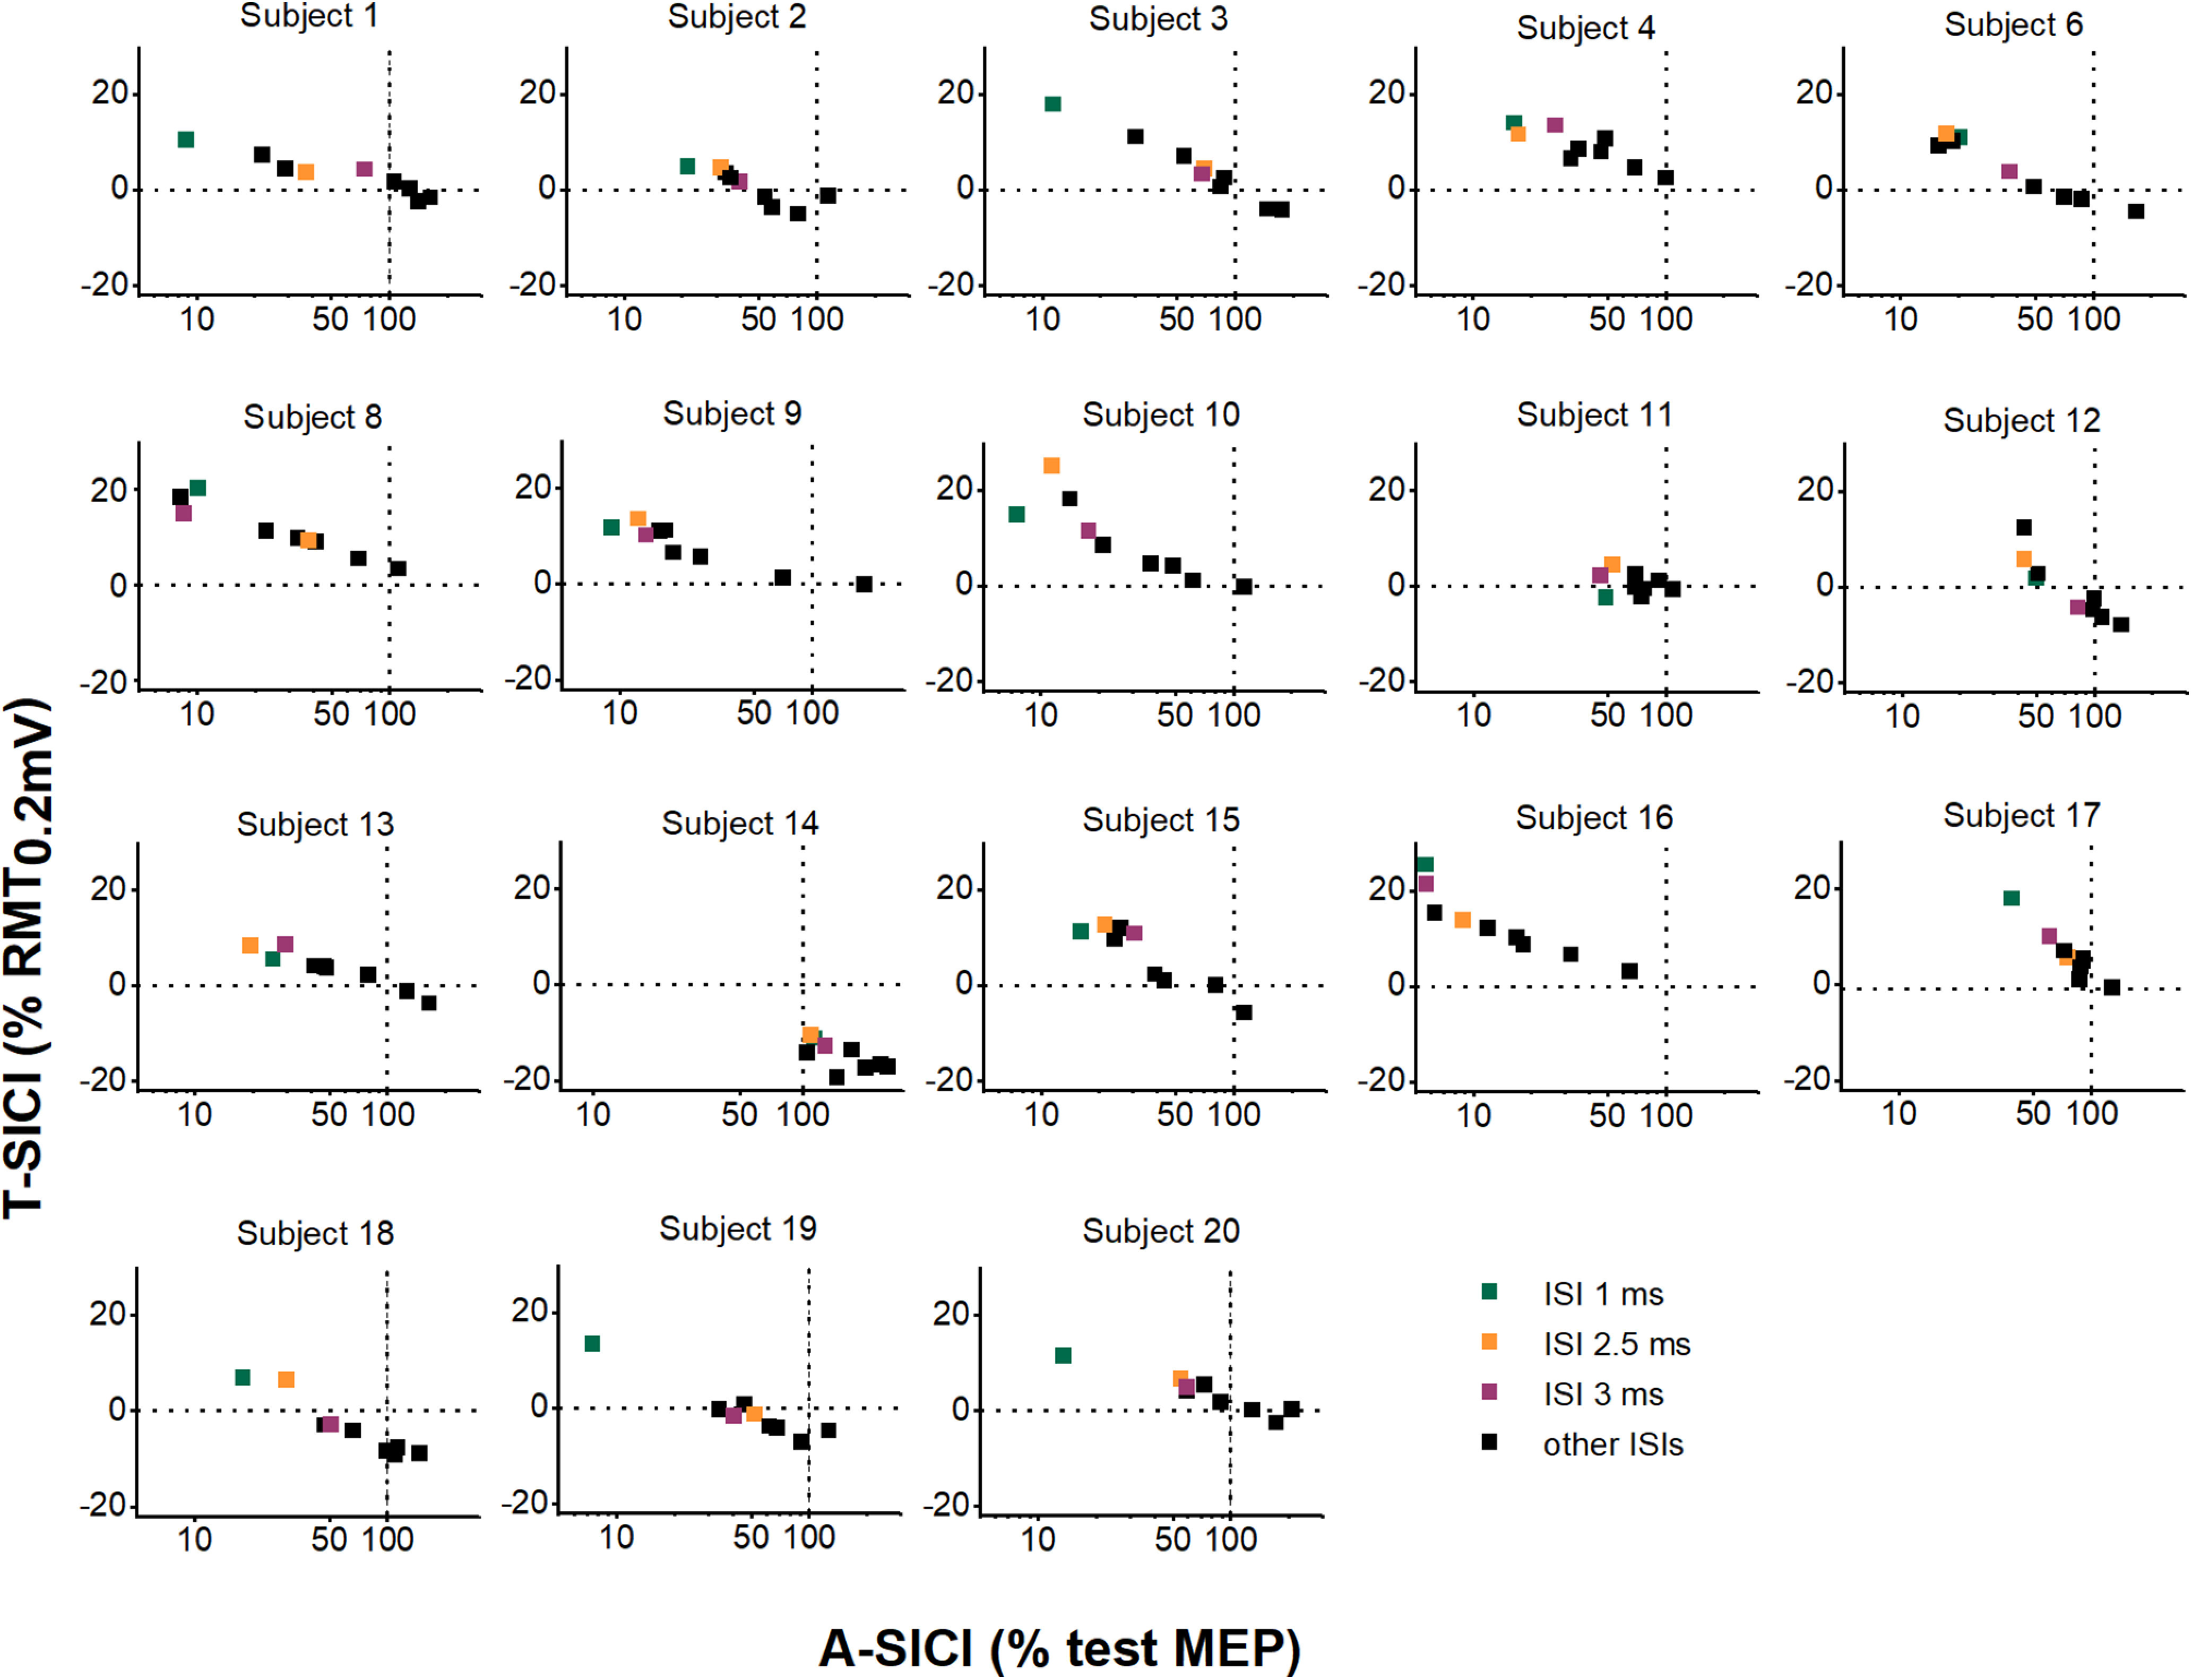
Relationship between A-SICI and T-SICI curves in individual subjects. Individual subject means of T-SICI (arithmetic) are plotted against A-SICI (geometric) at matching ISIs (calculated by averaging individual subjects’ means across all measurements). Black dashed lines indicate control conditions (0% RMT0.2mV for T-SICI, 100% test MEP for A-SICI). x-axis (log10 scale): A-SICI obtained by cTMS. y-axis (linear scale): T-SICI obtained by TT-TMS. In many subjects, the relationship between log-A-SICI and T-SICI appeared to be linear or near-linear. However, in some there seemed to be a “floor effect” with cTMS that was overcome by TT-TMS (e.g., subject 12, subject 15); in others, no apparent correlation between the techniques was seen (e.g., subject 11, subject 14).