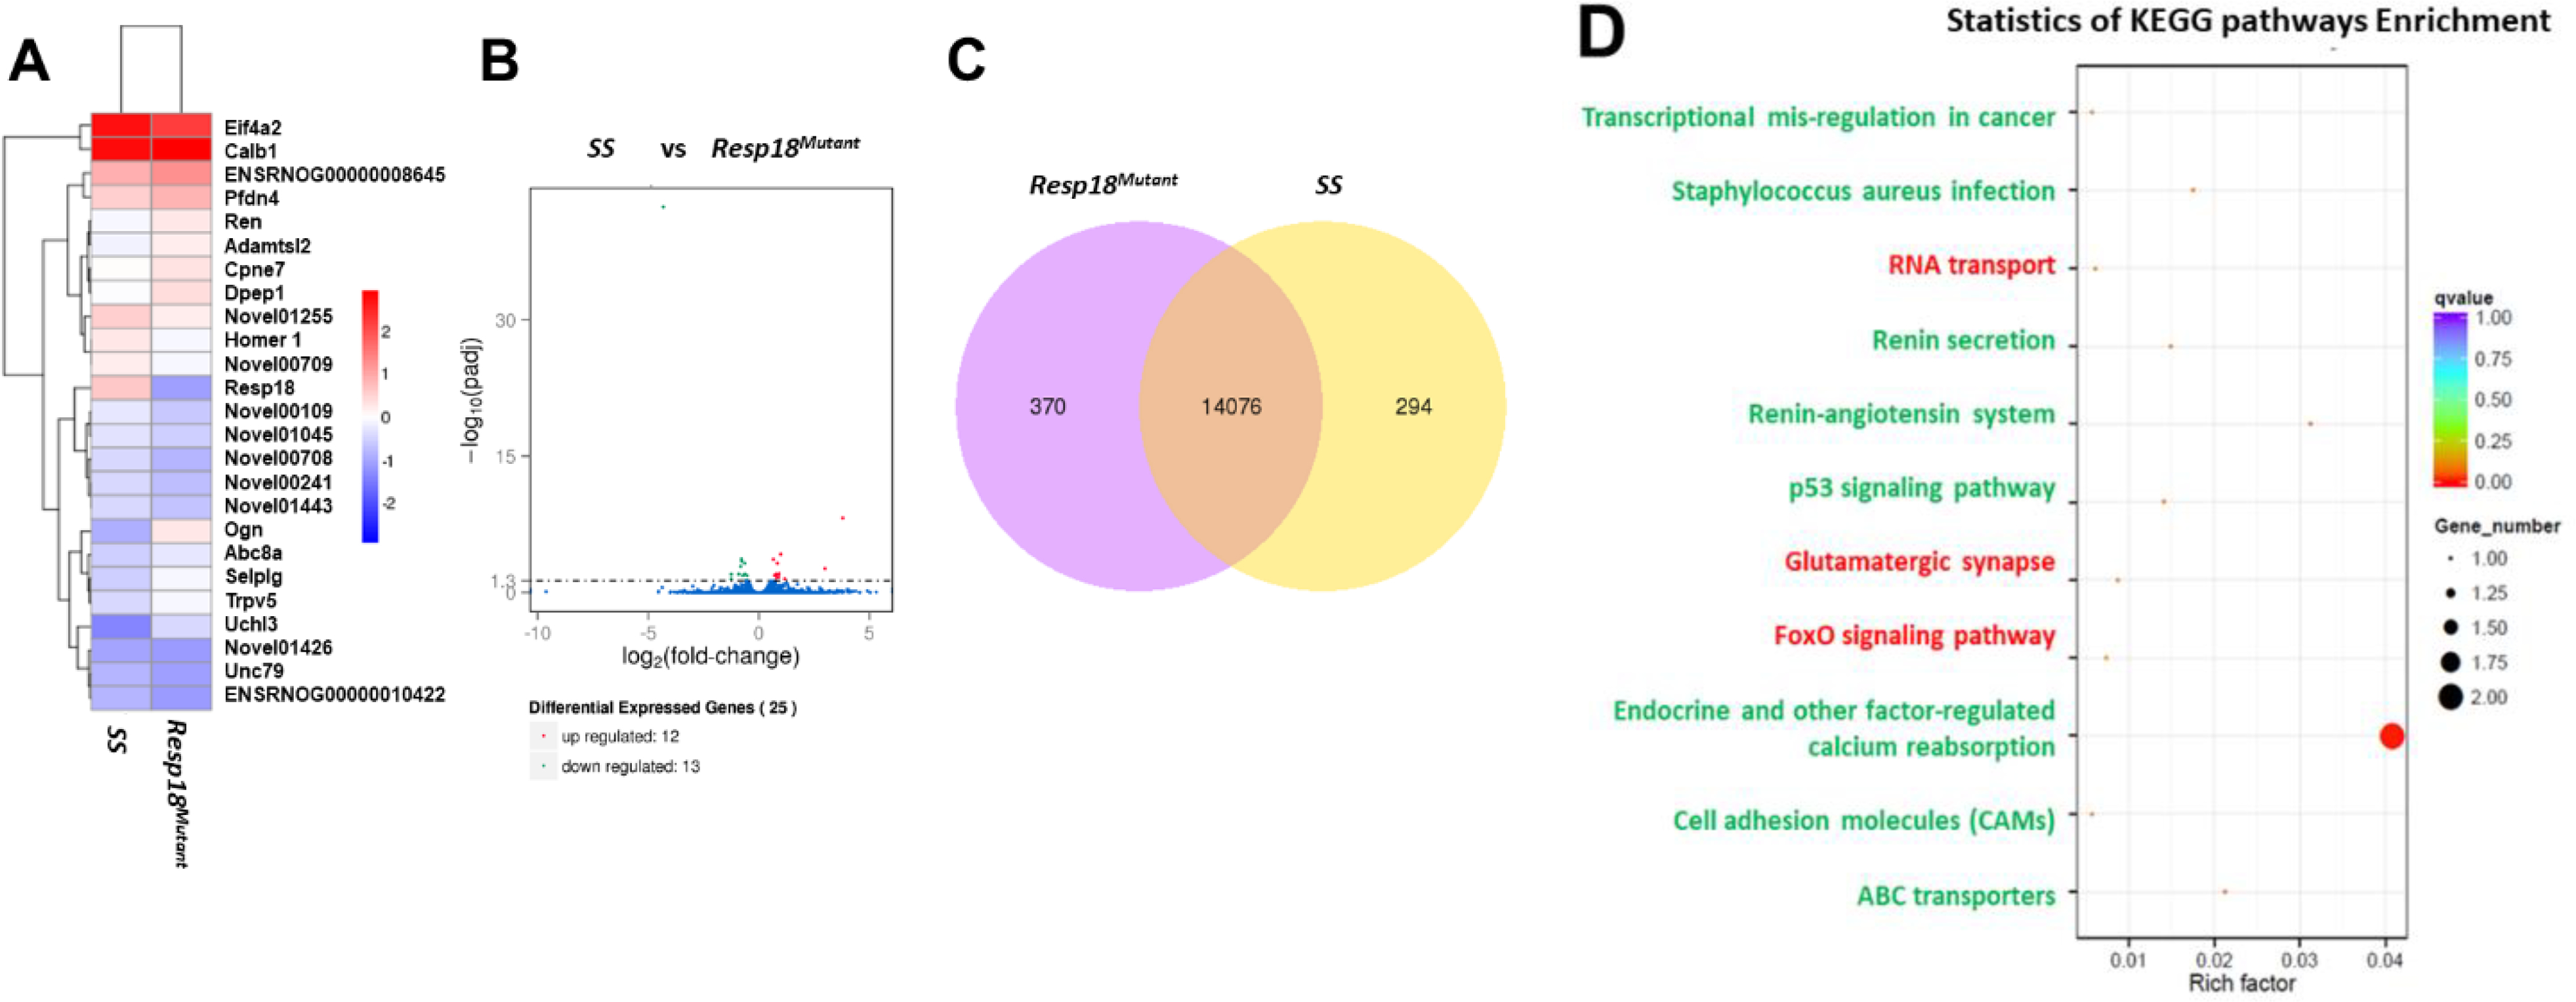
Figure 2. Transcriptome response to a 7-day exposure to a 2% high salt (HS) diet is altered in the Resp18mutant rat kidney, relative to wild-type SS rat kidney:

(A) Heat map results of a FPKM cluster analysis, using the log10 (FPKM+1) value. Red denotes renal genes with high expression levels; blue denotes renal genes with low expression levels in the Resp18mutant. (B) Volcano plots x-axis shows the fold-change in gene expression between samples (-log10(padj) and the y-axis shows the statistical significance of the difference (log2 (fold-change). Significant up- and down-regulated genes are highlighted in red and green, respectively. Genes which are not differentially expressed are in blue. (C) Venn diagram analysis with yellow representing uniquely expressed renal genes in the SS rat and purple representing uniquely expressed renal genes in the Resp18mutant rat (D) KEGG analysis of differential gene expression in kidneys. Green text represents pathways that correlate with upregulated genes; red text represents pathways that correlate with downregulated genes. Dot size represents the number of different genes and color represents the q-value.
