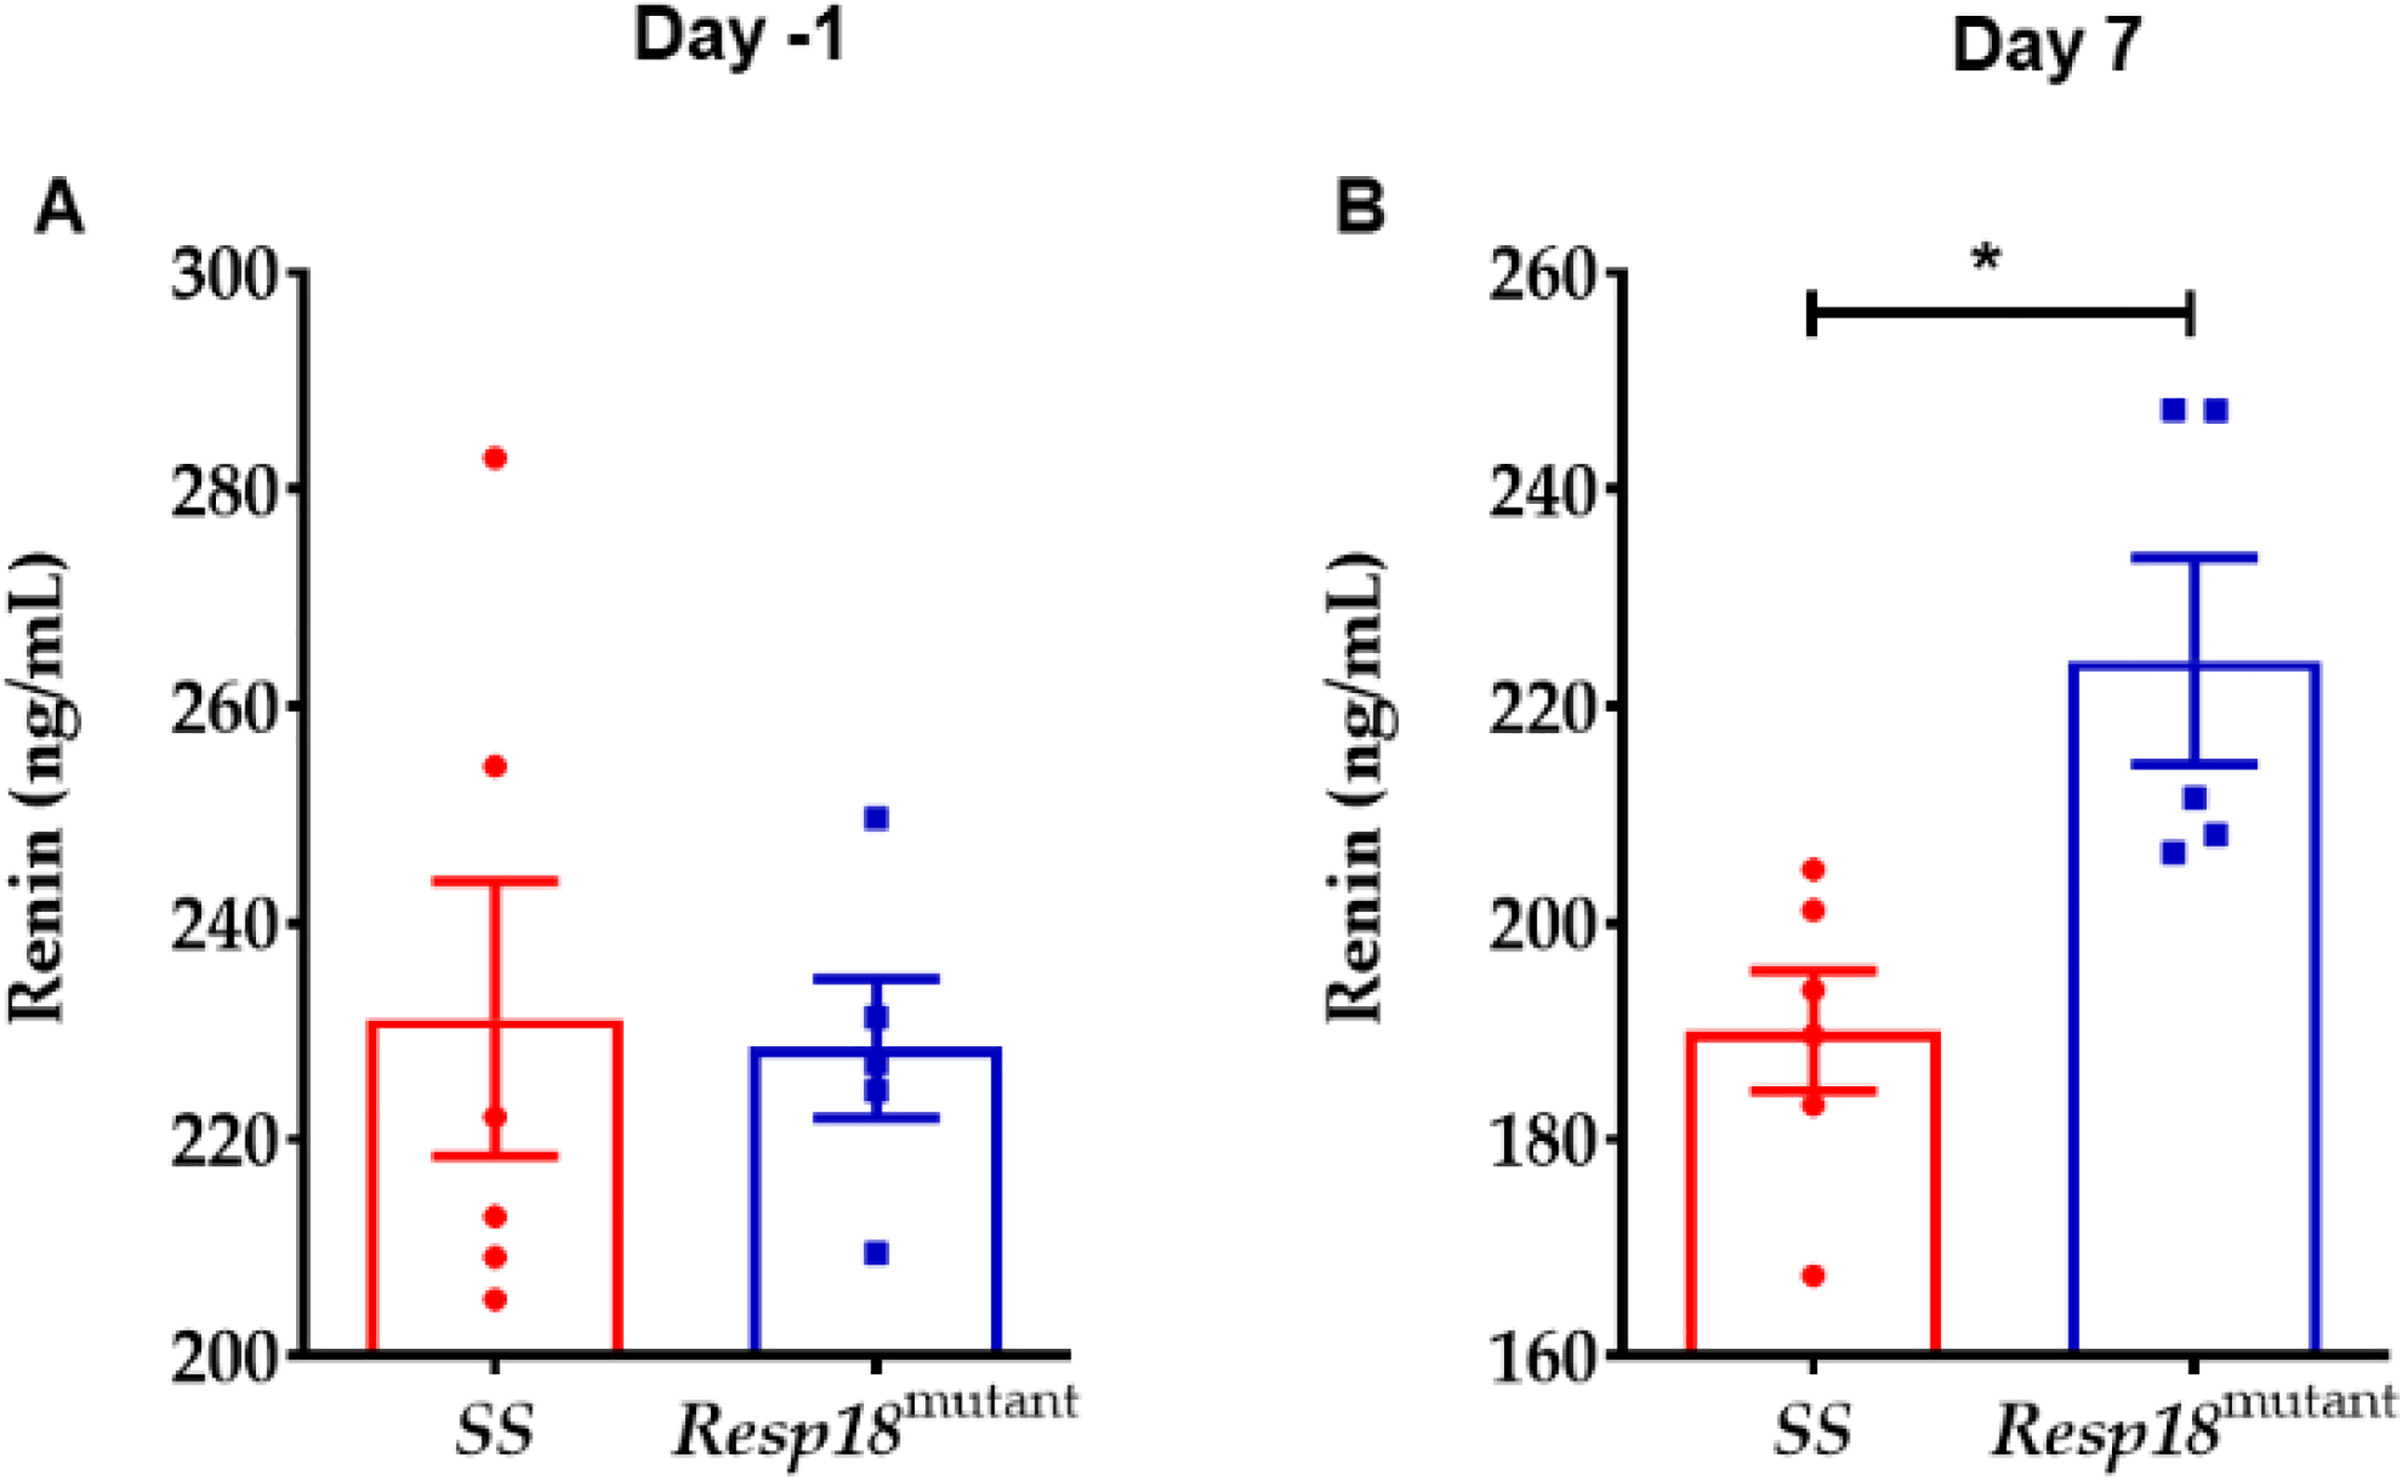
Figure 4: Renin levels in the Resp18mutant rat after a 7-day exposure to a 2% high salt (HS) diet:

(A) Serum samples collected from Resp18mutant and SS rats prior to exposure to the HS (n=5–6/grp) and after 7 days on HS (n=5–6/grp). Data represent mean±SEM. Statistical significance was calculated unpaired two-tailed t-test **p<0.05.
