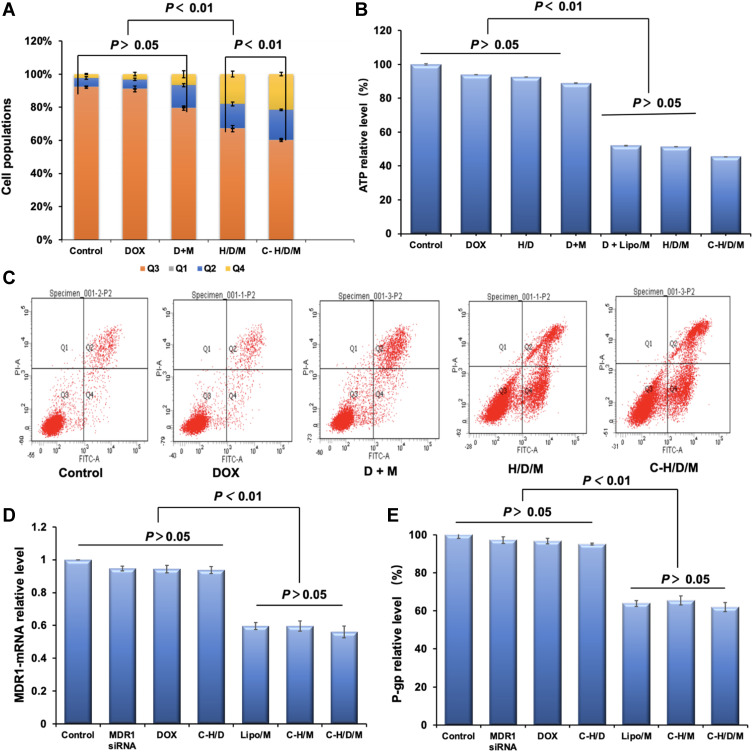
Figure 6.
Cell apoptosis of MCF-7/ADR cells treated by C-H/D/M for 48 h and in vitro gene silencing effect. (A) Statistical chart of cell cycle distribution of MCF-7/ADR cells treated with different treatment groups. (B) The ATP level in MCF-7/ADR cells of different groups. (C) Distribution of MCF-7/ADR cell apoptosis detected by flow cytometry in different treatment groups. (D) MDR1-mRNA levels of the MCF-7/ADR cells treated with different siMDR1 formulations were tested by RT-PCR. (E) P-gp levels of the MCF-7 cells treated with different siMDR1 formulations were tested by ELISA assay. The cells with no treatment was considered as a control. The data were presented as the mean ± SD, n=3.

