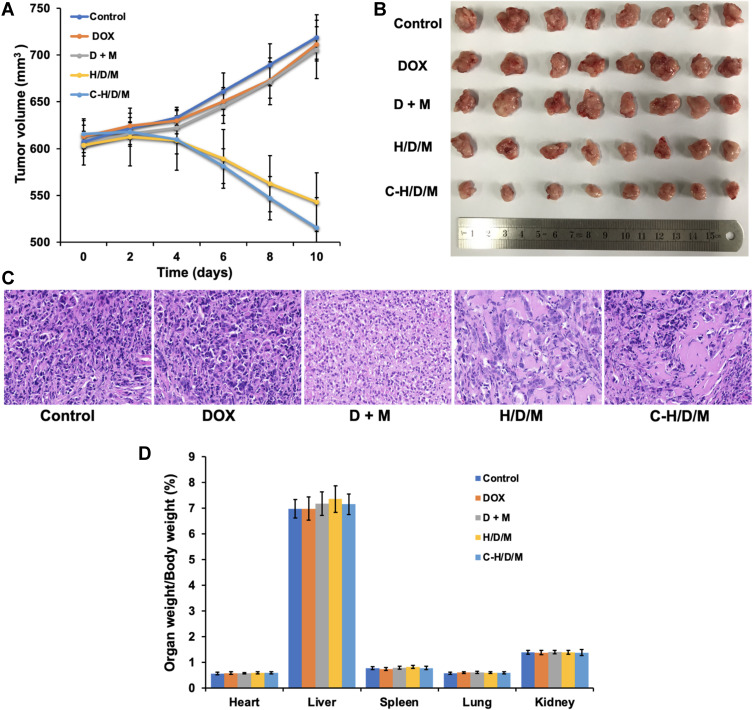
Figure 7.
In vivo tumor therapeutic efficiency of C-H/D/M. (A) Tumor volume changes of mice were measured every two days. (B) Image of tumors collected from the mice on the day after the last injection. (C) H&E staining of MCF-7/ADR tumor tissues in nude mice injected with NS (Control), DOX, DOX+siMDR1, H/D/M, C-H/D/M. (100×). (D) The ratios of organ weight to body weight. The data were presented as the mean ± SD, n=6.

