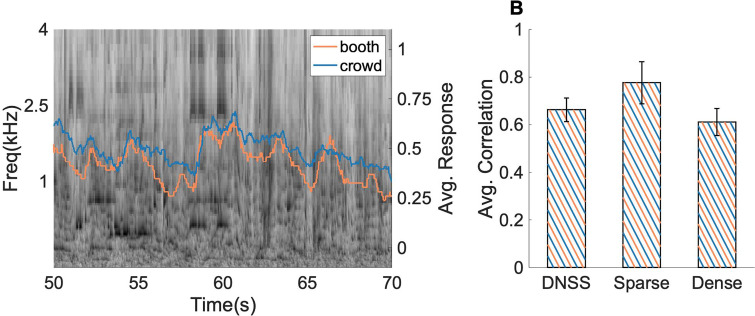
FIG. 3.
(Color online) Correlation between booth and crowd responses for DNSS scenes with an example. (A) Spectrogram of an example scene with booth, crowd average behavioral salience overlaid on the spectrogram. (B) Correlation between booth and crowd responses for DNSS scenes with sparse and dense breakup. Error bars depict ±1 SEM.

