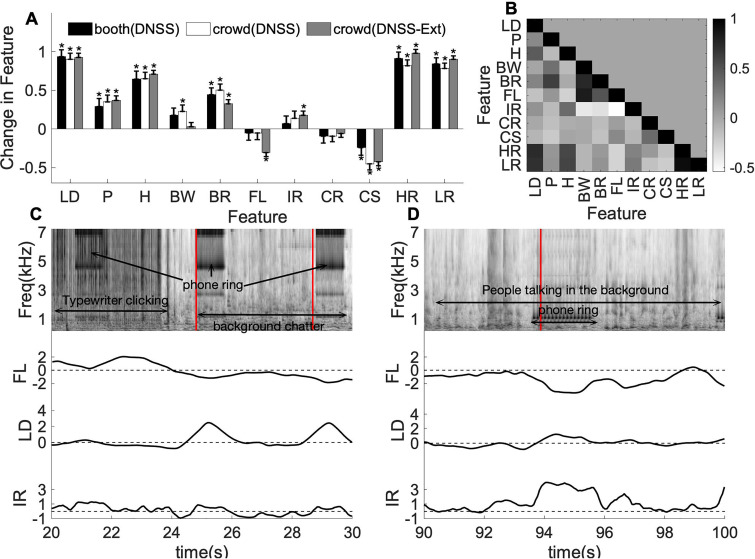
FIG. 6.
(Color online) (A) Acoustic feature change averaged across events, compared between sound booth and crowd for DNSS and DNSS-Ext scenes. All features are z-score normalized. Error bars represent ±1 standard error. (B) Correlations across features computed as Pearson correlation. (C) Example segment from one of the DNSS stimuli. (D) Example segment from one of the DNSS-Ext stimuli. (Top) Time-frequency spectrum of the signal, with a description of the scene in text and salient events marked by the vertical lines in red. Flatness, loudness, irregularity are shown in the bottom panels for the corresponding scenes.

