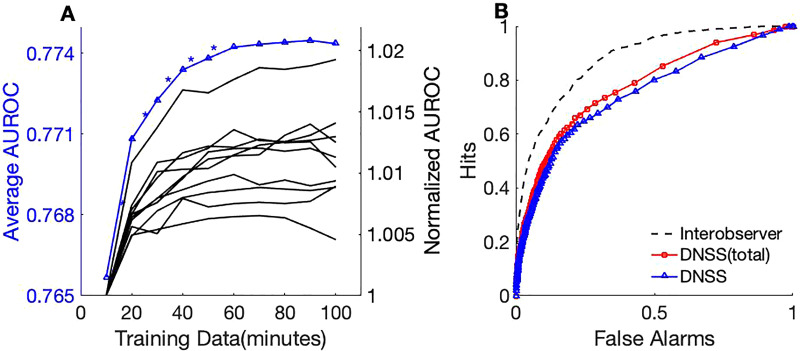
FIG. 7.
(Color online) (A) Event detection performance in terms of AUROC from incremental data augmentation. On the left y axis, the average AUROC of the 10-folds is plotted with each increment step and statistically significant improvements indicated with an asterisk. On the right y axis, each line represents a cross-validation fold and AUROC for each augmentation step is divided by the AUROC with 10 min of training data to obtain a normalized AUROC measure. All 56 scenes were used for this evaluation. (B) ROC with models trained on DNSS and DNSS-total when compared with the interobserver performance which can be considered an upper-bound to the detection performance.

