
Figure 1.
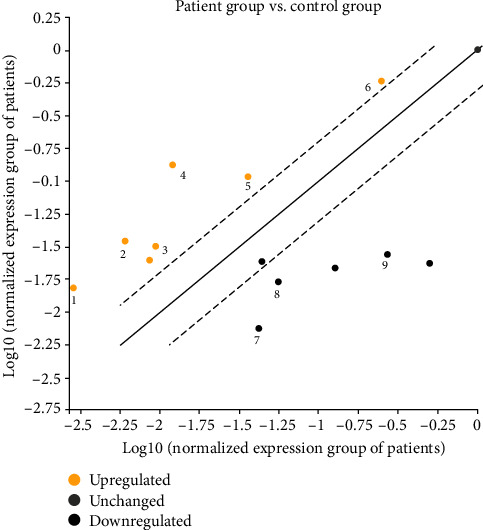
Scatter plot of significantly differentiated miRNA expressions in the patients with FMF as compared to control subjects (1: miR-340-5p, 2: miR-34a-5p, 3: miR-142-3p, 4: miR-216-5p, 5: miR-582-5p, 6: miR-429, 7: miR-569, 8: miR-1304-5p, and 9: miR-107).