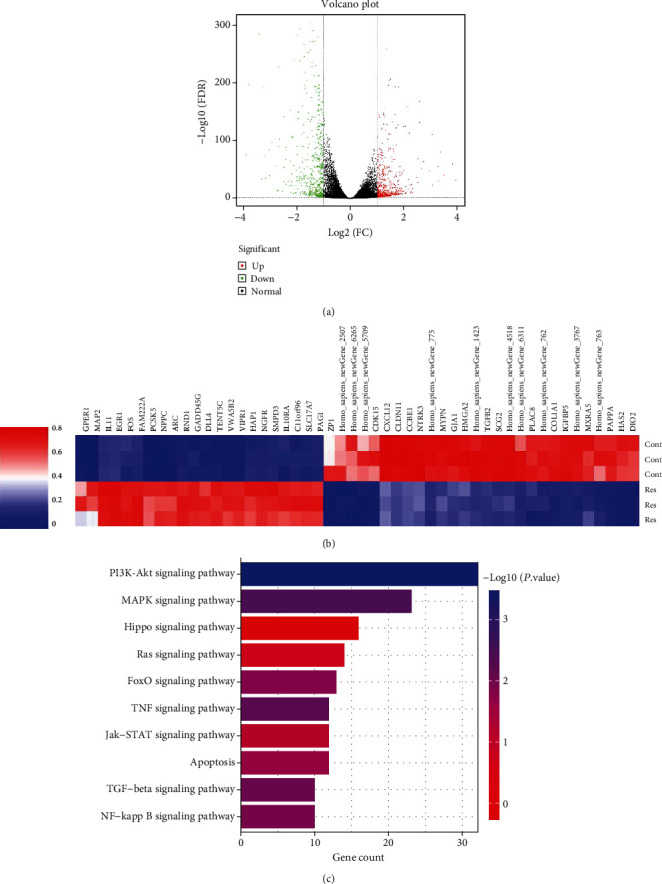
Figure 5.

The Hippo pathway is involved in the effects of Res on HSC inactivation. (a) Volcano plot of DEGs; the green dots represent downregulated DEGs, the red dots represent upregulated DEGs, and the black dots represent non-DEGs. (b) Heatmap. (c) KEGG analysis.
