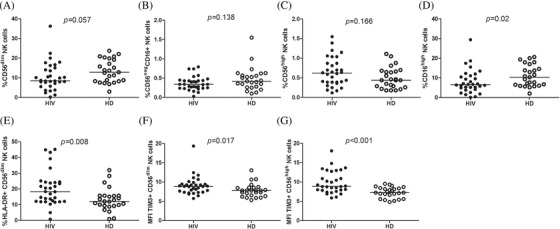
Figure 3.

Frequency of NK‐cell subsets, activation and exhaustion markers. Frequency of CD56dim, CD56negCD16+, CD56high and CD16high NK‐cell subset (a,b,c,d). HLA‐DR in CD56dim NK cells (d) and median‐intensity fluorescence (MFI) of TIM‐3 expression in CD56dim and CD56high NK subset (e,f,g). Mann‐Whitney U‐test was used to compare groups. HD, group of healthy donors; HIV, group of youths with vertically acquired HIV.
