
Figure 4.
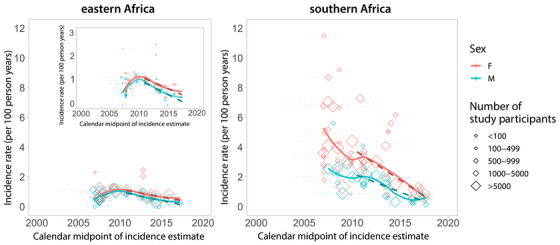
HIV incidence rates in general population studies over time by sex for eastern and southern Africa. We included incidence rate estimates from general population studies in southern and eastern Africa that had a study midpoint from 2007 onwards (this corresponds to the 25th percentile of all calendar midpoints reported, Figure 2d). Diamonds represent the calendar midpoint of the incidence rate estimate, while error bars represent the start and end date of the time interval over which the incidence rate was measured. Estimates are only shown for studies with an age range spanning 26 years or greater (e.g., an HIV estimate for individuals 18 to 44 years). Dashed lines show incidence trends fit using linear regression. Solid lines represent smoothed curves fit using LOESS regression. An inset is included for eastern Africa to highlight trends with a y‐axis restricted to three per 100 person‐years.