
Fig. 1. Overweight prevalence by age in all 90 LMIC (bars) and stratified by country income groups (symbols).
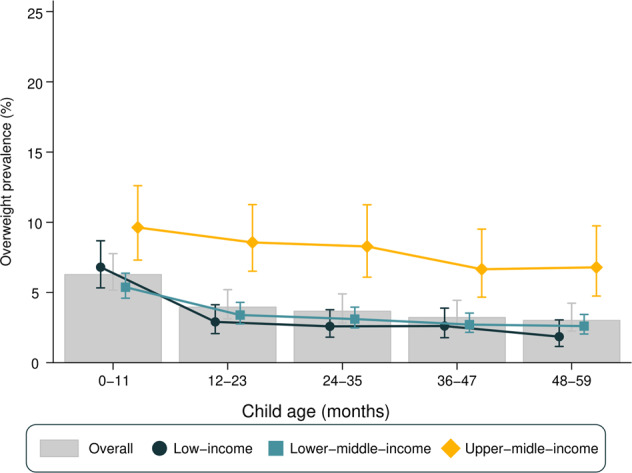
Error bars represent 95% confidence intervals for the prevalence in each group.
Official websites use .gov
A
.gov website belongs to an official
government organization in the United States.
Secure .gov websites use HTTPS
A lock (
) or https:// means you've safely
connected to the .gov website. Share sensitive
information only on official, secure websites.
Error bars represent 95% confidence intervals for the prevalence in each group.