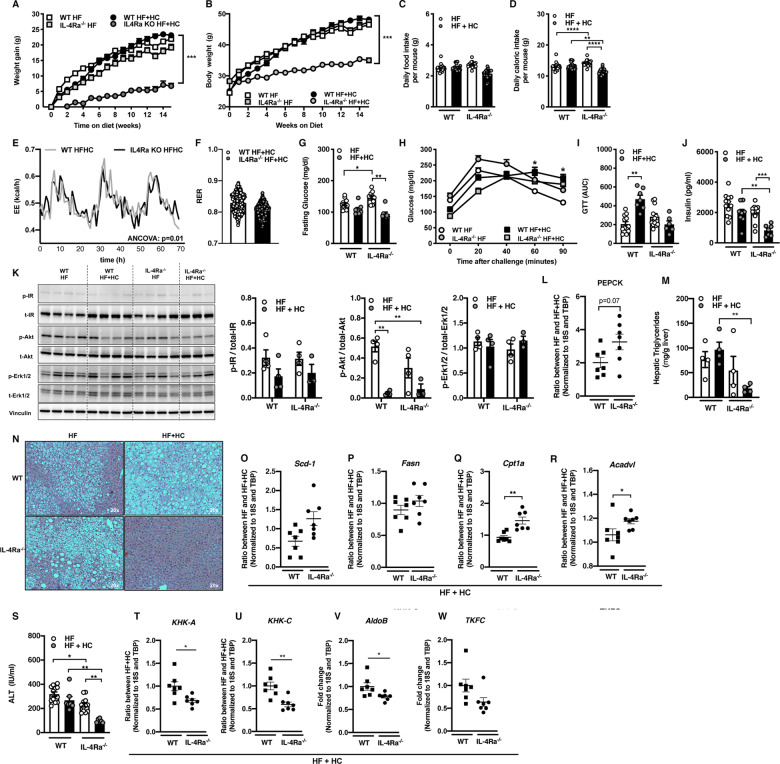
Fig. 2. IL-4Rα regulates HF + HC diet-induced weight-gain and associated metabolic sequelae.
WT and IL-4Rα−/− mice were fed a HF diet plus supplementation of fructose (HF + HC) for 16 weeks. A Total body weight gain over time. B Absolute body weight over time. C Daily food intake per mouse. D Daily caloric intake per mouse. E Energy expenditure (EE) in HF + HC at 6 weeks of dietary challenge. F Respiratory exchange rate (RER) at 6 weeks of dietary challenge. G Serum fasting glucose levels at 12 weeks of dietary challenge. H Glucose tolerance test over time at 12 weeks of dietary challenge. I AUC of glucose tolerance test at 12 weeks of dietary challenge. J Fasting insulin concentrations at time of harvest. K Liver IR, Akt, Erk1/2 levels at time of harvest as determined by western blot. L PEPCK gene expression in liver at time of harvest. M, N Liver triglycerides at time of harvest and representative histology images (H&E staining). O, P Fatty acid synthesis gene expression at time of harvest. Q, R Fatty acid oxidation gene expression at time of harvest. S Systemic alanine transaminase (ALT) levels at time of harvest. T, U KHK-A and KHK-C expression in liver at time of harvest. V, W AldoB and TKFC expression in liver at time of harvest. O–R, T–W Gene expression at time of harvest. A–D Representative of 2 independent experiments, n = 12/condition. E, F A single experiment n = 4/condition. G–J Representative of 2 independent experiments, n = 8–12/condition. K–N, O–R A single experiment n = 3–4/condition. S Representative of 2 independent experiments n = 8–12/condition. T–W A single experiment n = 6/7condition. In bar graphs and line graphs data represents mean ± SEM. A, B, H Area under the curve (AUC). C, D, G, I–M, S One-way ANOVA followed by multiple comparisons. *P < 0.05, **P < 0.01, ***P < 0.001. D, E Analysis of covariance (ANCOVA) with body weight as covariate. *p < 0.05, ***p < 0.001. O–R, T–W Unpaired two-tailed Student’s t test. *P < 0.05, **P < 0.01, ***P < 0.001, ****P < 0.0001.

