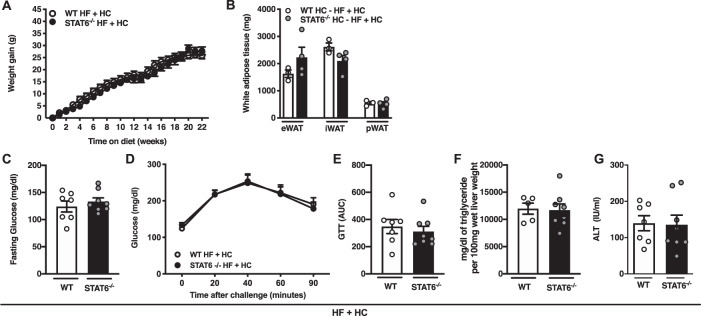
Fig. 5. STAT6 does not contribute to combined high-fat and high carbohydrate diet-driven obesity and metabolic sequelae.
WT and STAT6−/− mice were fed HF diet plus supplementation of fructose (HF + HC) for 22 weeks. A Total body weight gain over time. B White adipose tissue (WAT) weight at time of harvest. C Serum fasting glucose levels at 12 weeks of dietary challenge. D Glucose tolerance test at 12 weeks of dietary challenge. E Area under the curve (AUC) of glucose tolerance test at 12 weeks of dietary challenge. F Liver triglycerides at time of harvest. G Systemic alanine transaminase (ALT) levels at time of harvest. eWAT epidydimal WAT, iWAT inguinal WAT, pWAT perirenal WAT. A–G One independent experiment, n = 7–8/condition. In bar graphs and line graphs data represents mean ± SEM. A–G Unpaired two-tailed Student’s t test. *P < 0.05, **P < 0.01, ***P < 0.001, ****P < 0.0001.

