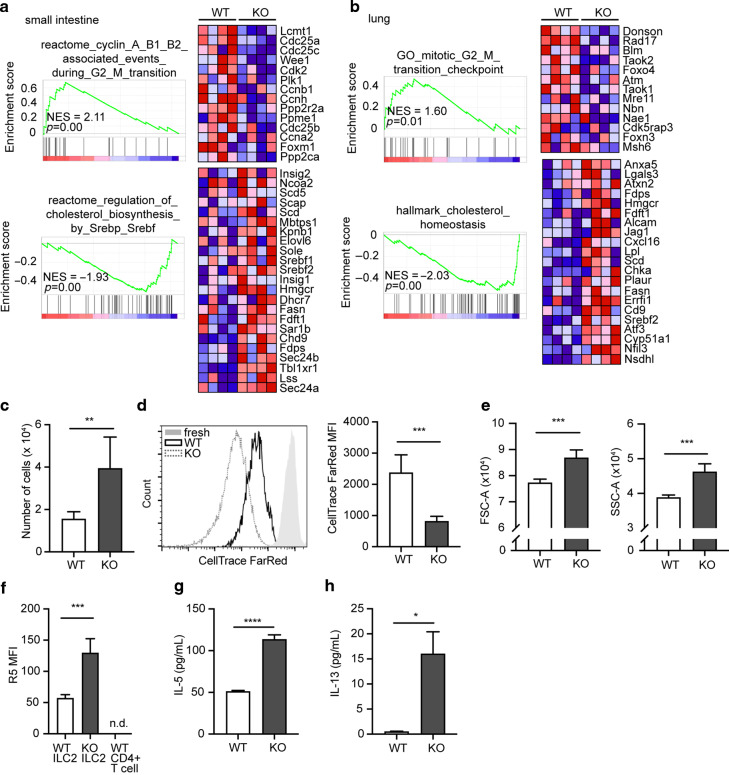
Fig. 4. CISH constrains proliferation and cytokine production in ILC2s.
a Gene set enrichment analysis of small intestinal ILC2s from WT or CISH KO mice. b Gene set enrichment analysis of lung ILC2s from WT or CISH KO mice. For a and b, each column represents sequenced cells from an individual mouse. Color blocks indicate row-normalized expression. n = 4 mice/group. c Number of live ILC2s after 1 week of culture in 10 ng/mL IL-2 and IL-7. **p < 0.01 by unpaired t-test. for c–f, n = 5 wells/group with each well derived from a single mouse. d Histogram (left) and graphical quantitation (right) of CellTrace Far Red dye dilution in cultured ILC2s. “fresh” indicates cells immediately after staining, without subsequent culture. ***p < 0.001 by unpaired t-test. e Forward scatter (FSC) and side scatter (SSC) of cultured ILC2s after 1 week of culture. ***p < 0.001 by unpaired t-test. f R5 MFI in cultured ILC2s. ***p < 0.001 by unpaired t-test. g IL-5 from culture supernatant of cells cultured for 4d in IL-2 and IL-7. ****p < 0.0001 by unpaired t-test. n = 4 wells/group, derived from a split pooled collection of ILC2s from 8 mice/genotype. h IL-13 from culture supernatant of cells cultured for 4d. *p < 0.05 by unpaired t-test. n = 4 wells/group.

