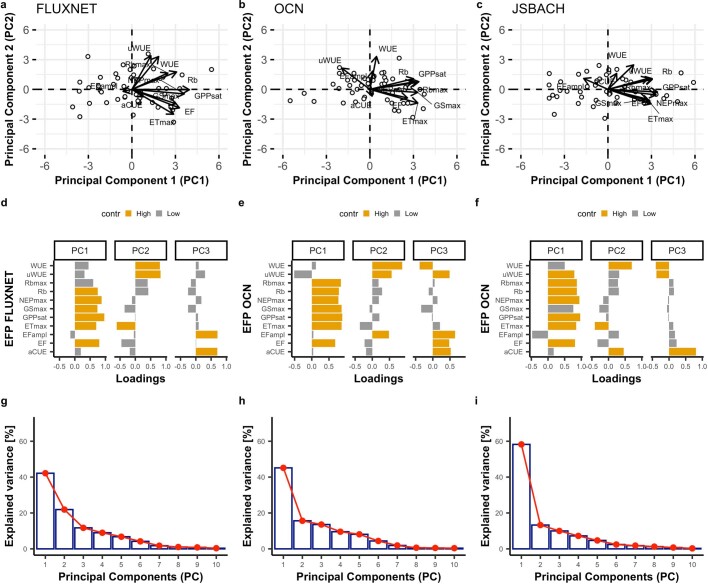
Extended Data Fig. 7. Comparing observed and modelled global ecosystem functional trade-offs.
PCA for a subset of 48 FLUXNET sites mainly distributed in temperate and boreal regions and 2 different land surface models (Supplementary Table 1). The left column is FLUXNET, the centre column is OCN, and the right column is JSBACH. Panels a, b, c: the biplot resulting from the PCA. Panels d, e, f, bar plot of the loading of each ecosystem functional property to each principal component. Orange bars represent the loadings that are selected as significant and with high contribution (Supplementary Information 2). Panels g, h, i report the variance explained by each principal component. EFP acronym list: apparent carbon-use efficiency (aCUE), evaporative fraction (EF), amplitude of EF (EFampl), maximum evapotranspiration (ETmax), gross primary productivity at light saturation (GPPsat), maximum surface conductance (Gsmax), maximum net ecosystem productivity (NEPmax), maximum and mean basal ecosystem respiration (Rbmax and Rb, respectively), and growing season underlying water-use efficiency (uWUE). Note that the PCA results for FLUXNET (panels a, d, g) are different from Fig. 1 because here we use the subset of 48 sites used for the modelling analysis.

