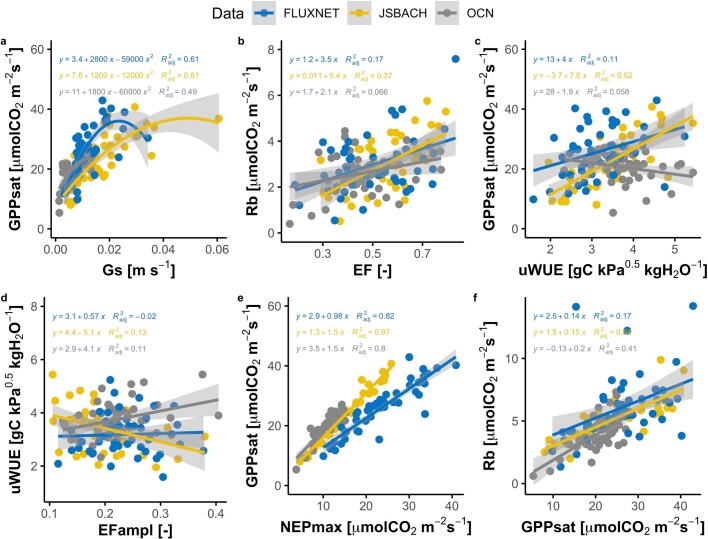
Extended Data Fig. 8. Pairwise relationship between some key ecosystem functional properties derived from FLUXNET, and modelled with JSBACH and OCN.
n = 48 sites; see Supplementary Table 1. The grey areas represent the 95% confidence interval of the linear and nonlinear regression. Overall the correlation between modelled functions is larger than in the observations. Acronym list: evaporative fraction (EF), amplitude of EF (EFampl), gross primary productivity at light saturation (GPPsat), maximum surface conductance (Gs), maximum net ecosystem productivity (NEPmax), basal ecosystem respiration (Rb), and growing season underlying water-use efficiency (uWUE).

