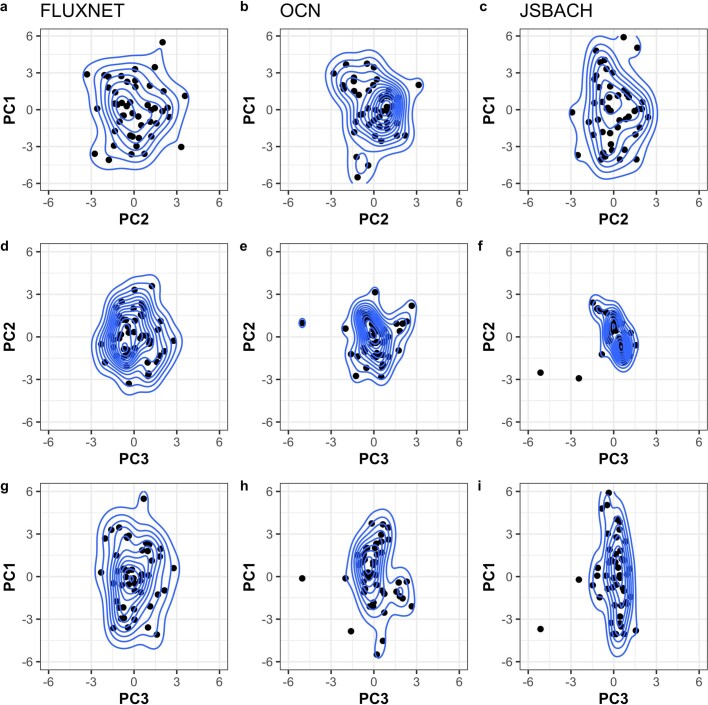
Extended Data Fig. 9. Representation of the 2D ecosystem functional properties space derived from FLUXNET observations and land surface model runs (OCN, JSBACH).
The points represent the principal component (PC) value calculate for each site. The contour lines are computed using a 2D kernel density estimates. The contour lines show the area occupied by ecosystem functional properties and its boundary that, according to the results of the analysis, are set by vegetation characteristics (PC1), water availability, abiotic limitations, and vegetation height (PC2), and above-ground biomass, foliar nitrogen and atmospheric aridity (PC3). The areas computed for FLUXNET are wider than for the models, particularly for PC2 and PC3. This means that ecosystem functional properties as simulated by models are more constrained than for the observations.

