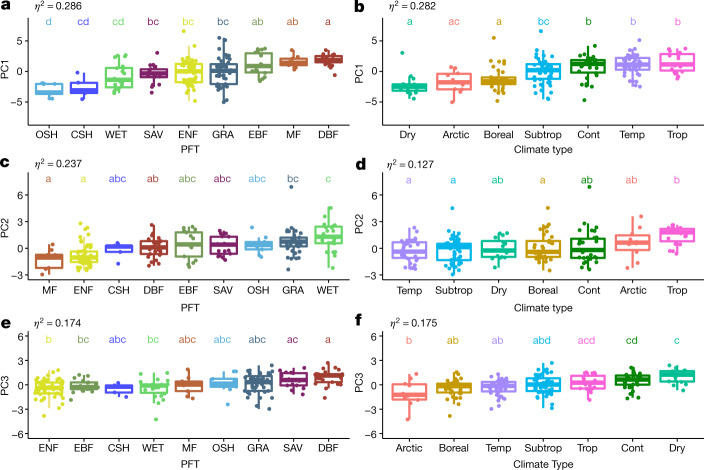
Fig. 2. Distribution of plant functional types and climate types along the principal components (PC1–PC3).
a, c, e, Plant functional types (PFTs). b, d, f, Climate types. Letters represent statistically significant differences in the average PCs (Tukey’s HSD test, P < 0.05), such that groups not containing the same letter are different. The effect size of the one-way ANOVA (η2) is reported (n = 203 sites). In the box plots the central line represents the mean; the lower and upper box limits correspond to the 25th and 75th percentiles and the upper (lower) whiskers extend to 1.5 (−1.5) times the interquartile range, respectively. Colours indicate different climate types and PFTs (cont, continental; subtrop, subtropical; temp, temperate; trop, tropical; PFT definitions are as in Fig. 1).

