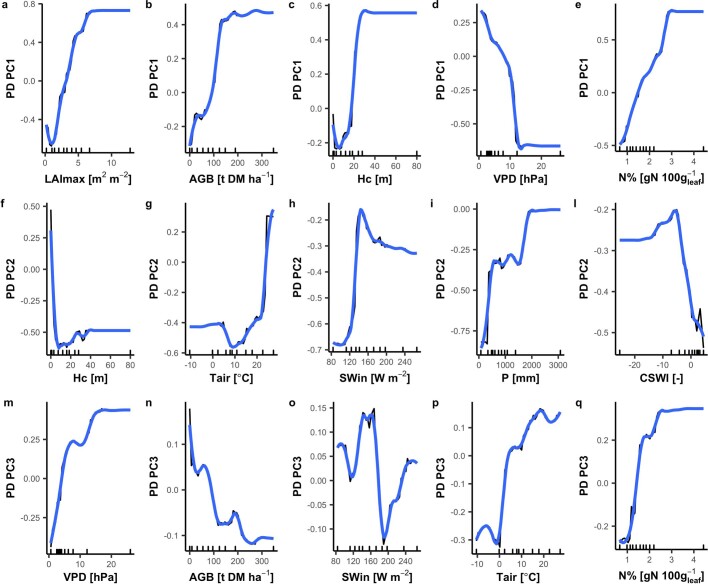
Extended Data Fig. 4. Results of the relative importance analysis conducted with the Random Forest and partial dependence.
See ‘Predictive variable importance’ in Methods. The slopes of the partial dependence plot indicate the sensitivity of the response (PCs) to the specific predictor. The out-of-bag cross-validation leads to predictive explained variance of 56.76% for PC1, 30.24% for PC2, and 20.41% for PC3. The portion of unexplained variance might be related to missing leaf traits predictor such as leaf mass per area or phenological traits. The partial dependence plots of all variables are shown: top panels for PC1 (a–e), middle panels for PC2 (f–l), and bottom panels for PC3 (m–q). The blue lines represent the locally estimated scatterplot (LOESS) smoothing of the partial dependence. Tick marks in the x axis represent the minimum, maximum and deciles of the variable distribution.

