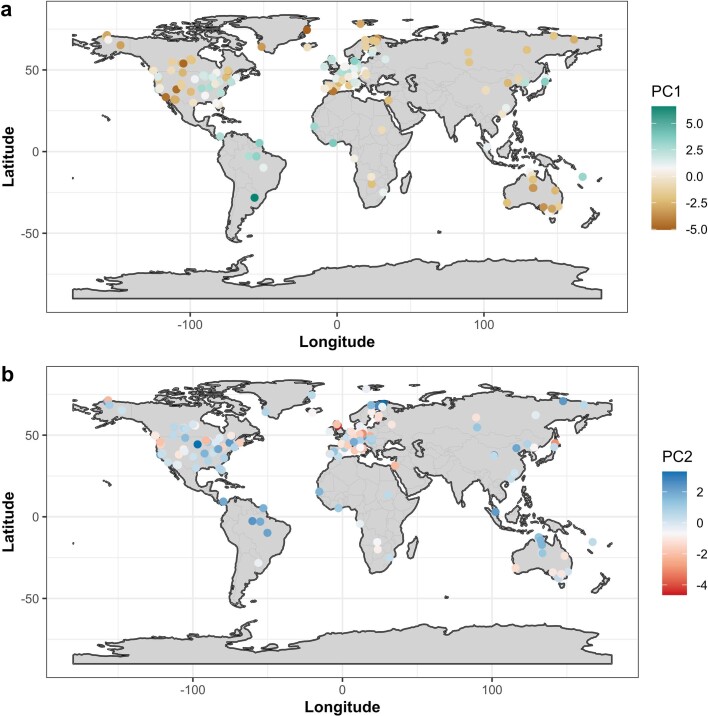
Extended Data Fig. 5. Map of FLUXNET sites colour-coded for the value of PC1 and PC2.
a, PC1. b, PC2. The map of the PC1 shows the areas of the globe with high productivity (positive values of PC1 in the temperate areas, Eastern North America, Eastern Asia, and Tropics), and areas characterized by lower productivity (Semi-arid regions, high latitude and Mediterranean ecosystems). The map of the PC2 shows the gradient of evaporative fraction and the spatial patterns of water use efficiency. This PC2 runs from sites with a high evaporative fraction (i.e. available energy is dissipated preferentially to evaporated or transpired water), high surface conductance, and low water use efficiency (positive PC2 values), to water limited sites (i.e. low evaporative fraction where available energy is mainly dissipated by sensible heat) that also show higher water-use efficiency (negative PC2 values). The maps were generated with the ggplot2 R package74. The shape files used to create the maps were downloaded from https://github.com/ngageoint/geopackage-js.

