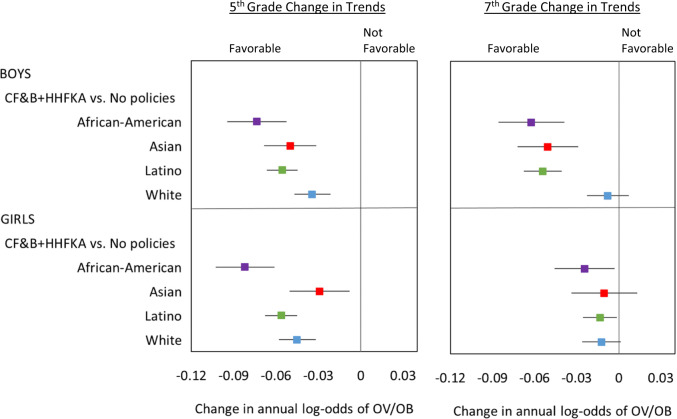
Fig. 3. Cumulative change in overweight/obesity trends.
For each grade, sex and racial/ethnic group, the figure shows changes in OV/OB trends, comparing the period when both state and federal policies were simultaneously in place (2013–2016) to the period when no policies were in place (2002–2004). Estimates are based on models using California student‐level Fitnessgram data 2002‐2016, adjusted for student, school, and school‐neighborhood covariates. The point estimates and confidence intervals show the change in the annual the log‐odds of OV/OB comparing periods as indicated, representing the extent to which the prevalence trends changed in a favorable direction (negative change in slope), or not favorable direction (positive change in slope), or remained unchanged (difference in slope not significantly different from zero).

