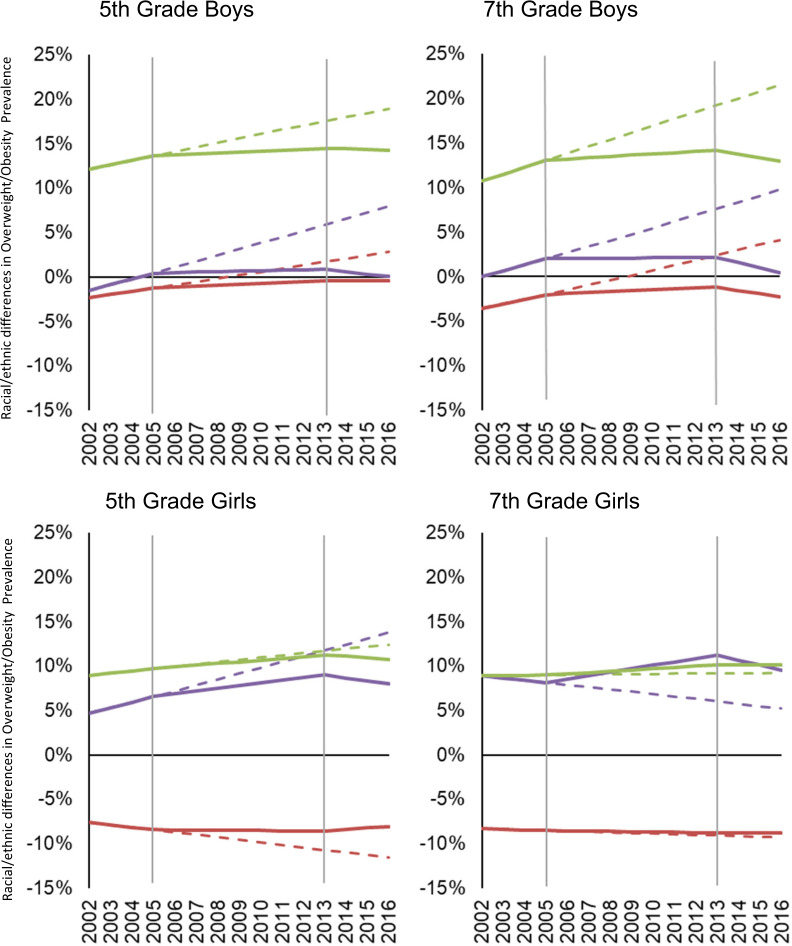
Fig. 5. Disparities in OV/OB prevalence during the study period.
For each grade and sex group, panels show racial/ethnic disparities in overweight/obesity prevalence. The dashed lines assume pre-policy trends remain unabated; solid lines show disparities estimates before (2002–2005) and after the California Nutrition Policies (2005–2012), and after the Federal Policy for School Meals (HHFKA) took effect (2013–2016). Based on models using annual California student-level Fitnessgram data from 2002 to 2016, adjusted for student, school and school- neighborhood covariates. Horizontal Line at 0% indicates white peers are the reference. Vertical lines depict inflection points when policies are assumed to accrue effects. Negative percents mean the Asian students had lower OV/OB prevalence compared with their White peers in respective grade. The color lines represent each of the racial/ethnic groups: Purple = African American; Red = Asian; Green = Latino.

