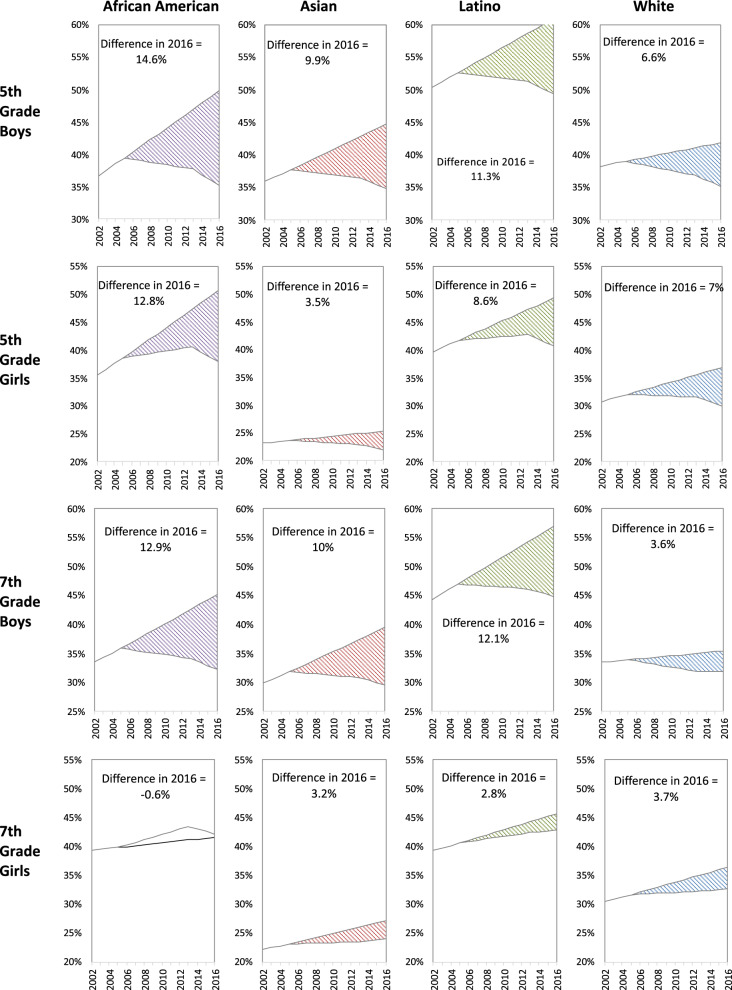
Fig. 6. Comparison of estimated and counterfactual overweight/obesity prevalence with and without the policies.
For each sex-, grade-, and racial/ethnic-group, the panels show overweight/obesity prevalence estimated using models fitted with the policies in place (solid line) and a counterfactual prevalence assuming trends in the pre-policy period (2002–2004) continue (dashed lines). Shaded area represents the difference in 2016 prevalence without versus with the policies in place.

