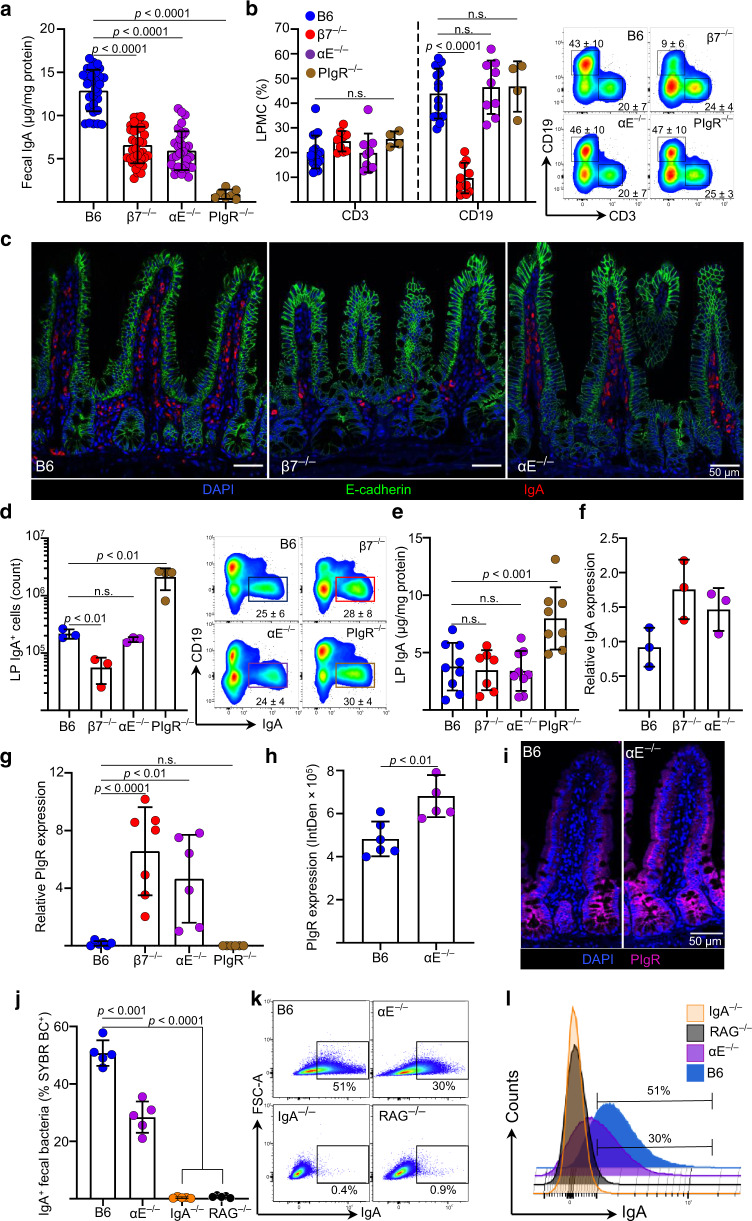
Fig. 1. Integrin αE deficiency leads to a fecal IgA deficit despite normal B cell recruitment, IgA production and increased pIgR mRNA expression.
a Fecal IgA levels measured by ELISA in C57BL/6 (WT), Itgb7−/− (β7−/−), Itgae−/− (αE−/−) and pIgR-deficient (pIgR−/−) mice. b Percentage of CD3+ and CD19+ cells within the ileal LP of indicated strains and representative contour plots of indicated cell subsets gated on live, single cellular events. c IF staining of IgA + ASC and E-cadherin, representative coronal images of terminal ileum (TI). d Absolute numbers and representative dot plots of IgA + ASCs in lamina propria. e LP IgA levels measured by ELISA of indicated strains (f) ileal IgA mRNA transcripts in ilea of indicated mice (g) pIgR mRNA expression in ileum of indicated mice. h Relative pIgR fluorescence intensity expressed as integrated density (IntDent, see “Methods”) per villi and (i) representative IF images (j) Percentage of IgA-coated fecal bacteria measured by flow cytometry and (j, k, l) representative plots and histograms of IgA coating of indicated mouse strains. Each data point (mean ± SD) represent a single mouse with n ≥ 5 from 2 or 3 independent experiments. Statistical significance determined using two-way ANOVA with Dunnett’s multiple comparisons test.

