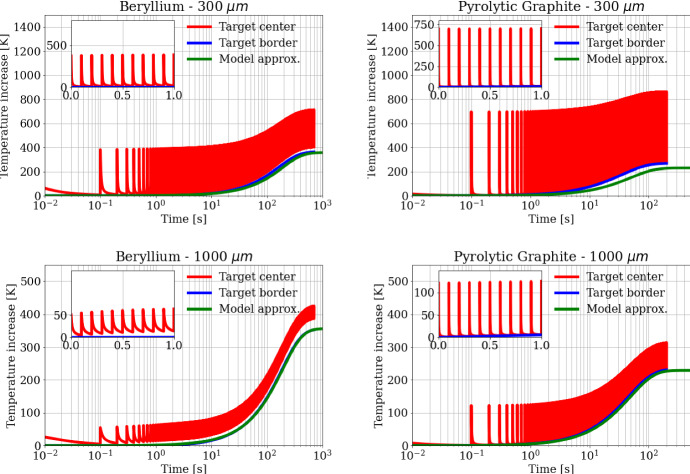
Fig. 11.
Temperature trends for (left) Beryllium and (right) Carbon targets following a train of 100 bunches at a train repetition rate of 10 Hz. Plots in the top row show the time evolution for a beam spot size of 300 μm while the bottom row for a beam spot size of 1000 μm. The red curves represent the temperature increase at the target center, the blue curves represent the temperature increase at the target border, and the green curves represent the model approximation for target average temperature

